Best Data Visualization Tools - Page 38

How Many Data Visualization Tools Products Does G2 Track?

Total Products under this Category: 762

Category Stats (Nov 2026)

  • Average Rating: 4.44/5 The average rating of products in this category, based on all submitted ratings
  • Top Trending Product: Upsolve AI (+1.75%) - Among all products in this category, Upsolve AI recorded the largest rating increase compared to last month

Last updated: November 01, 2026

How Does G2 Rank Data Visualization Tools Products?

Why You Can Trust G2's Software Rankings:

  • 30 Analysts and Data Experts
  • 22,900+ Authentic Reviews
  • 762+ Products
  • Unbiased Rankings

G2's software rankings are built on verified user reviews, rigorous moderation, and a consistent research methodology maintained by a team of analysts and data experts. Each product is measured using the same transparent criteria, with no paid placement or vendor influence. While reviews reflect real user experiences, which can be subjective, they offer valuable insight into how software performs in the hands of professionals. Together, these inputs power the G2 Score, a standardized way to compare tools within every category.

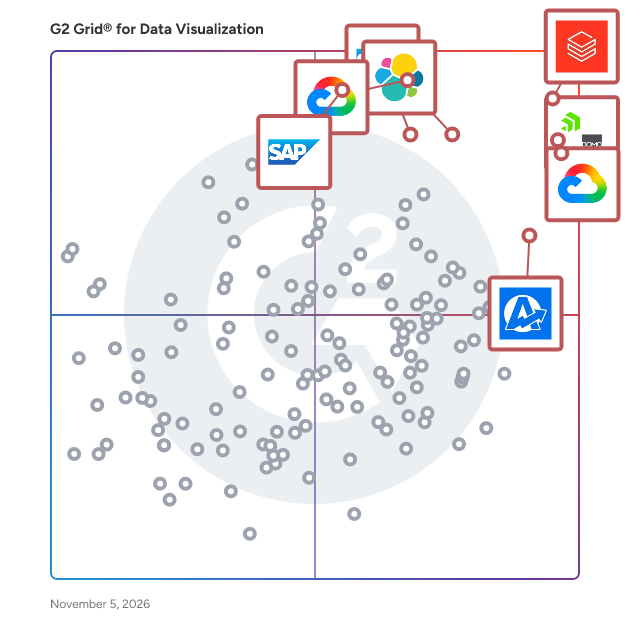
G2 Grid® for Data Visualization Tools

G2 Grid® for Data Visualization Tools plotting products by satisfaction and market presence

Highlighted products: Databricks, Domo, Looker, Data Studio, Elastic Stack, AgencyAnalytics, SAP HANA Cloud, and SAP Analytics Cloud.

Underlying data: [Grid® JSON](https://www.g2.com/categories/data-visualization-tools/grids.json?focus%5B%5D=databricks&focus%5B%5D=domo&focus%5B%5D=looker&focus%5B%5D=data-studio&focus%5B%5D=elastic-stack&focus%5B%5D=agencyanalytics&focus%5B%5D=sap-hana-cloud-2025-10-01&focus%5B%5D=sap-analytics-cloud&segment=all)

LivChart

LivChart is an AI-assisted business intelligence and analytics platform that helps teams turn operational data into interactive dashboards, charts, reports, and actionable insights. It combines data onboarding, ETL, query building, dashboard design, alerting, and governed user access in a single workspace. With LivChart, teams can connect files, databases, and web service data sources; prepare and enrich datasets in DataStudio; build reusable query and semantic layers; and create dashboards with charts, KPIs, filters, pivots, grids, drill-downs, forecasts, radar signals, and AI-generated insights. Users can explore data through interactive dashboards, create personal charts with the AI Chart Wizard, work in an Excel-like Analytics Studio, export PDF reports, send email summaries, define threshold-based alarms, and share dashboards, charts, or workbooks securely. LivChart is designed for organizations that need more than static reporting. It supports both admin-governed system dashboards and personal analytical workspaces, with subject-based permissions, role management, device binding, scheduled tasks, plugin-based data enrichment, and health checks for operational reliability. Its AI features assist with chart generation, dashboard insights, workbook actions, and exploratory analysis while keeping data preparation, review, and governance under user and admin control.

Who Is the Company Behind LivChart?

Living Charts

Living Charts is a browser-based data visualization and animation tool that helps users turn spreadsheet data into engaging animated charts and videos without coding or motion design skills. It is designed for creators, marketers, educators, journalists, analysts, and businesses that need to communicate changing data clearly and visually. Users can import or enter their data, choose an animated chart type, customize the design and animation, preview the result, and export the finished visualization as a video. Living Charts supports multiple animated chart formats, including Bar Chart Race, Line Chart Race, Stacked Line Chart Race, Pie Chart Race, Bubble Chart Race, and Table Chart Race. These formats are especially useful for visualizing rankings, trends, market share, historical changes, sports statistics, business metrics, and other time-series data. The platform provides extensive customization options for colors, fonts, labels, values, backgrounds, layouts, number and date formatting, animation duration, timing, and transitions. Users can also add images, logos, flags, text elements, timeline events, and dynamic counters such as Total, Average, or Median to create more engaging data stories. One of the main differences between Living Charts and many traditional data visualization platforms is its focus on animated video content. Users can create chart animations directly in the browser and export them as video for YouTube, TikTok, Instagram, presentations, educational content, and other publishing channels. Living Charts does not require programming knowledge and is intended to provide a faster alternative to manually creating animated charts with video editing software or custom code. The service includes a free plan for users who want to create and test animated visualizations, as well as paid plans that provide additional customization options, unlimited projects, watermark removal, additional fonts, team collaboration, and other advanced features. Living Charts is particularly well suited for anyone looking for a no-code animated chart maker, bar chart race generator, ranking video maker, or data visualization tool with direct video export.

Who Is the Company Behind Living Charts?

AI can help you find the answers. G2 helps you trust them.

Connect G2 to Claude or ChatGPT for answers grounded in G2's trusted reviews, comparisons, and pricing from real user insights.

How it works

Lumenad

Lumenad is advertising intelligence software that enables hassle-free organization, management and reporting of cross-channel data. Marketing teams can use Lumenad as the source-of-truth to drive performance of digital advertising campaigns. Our software takes the guesswork out of media data analysis, enabling marketers to quickly and accurately draw conclusions and make campaign optimizations. Reporting – whether it’s throughout the campaign or upon its conclusion – is a high-quality, seamless experience and has been built with a marketer in mind.

Average Rating: 4.2/5.0

Total Reviews: 3

How Do G2 Users Rate Lumenad?

  • Has the product been a good partner in doing business?: 10.0/10 (Category avg: 9.0/10)

Who Is the Company Behind Lumenad?

  • Seller: LumenAd
  • Year Founded: 2015
  • HQ Location: Missoula, US
  • LinkedIn® Page: www.linkedin.com
    6 employees on LinkedIn®

Who Uses This Product?

  • Company Size: 100% Small

What Are Recent G2 Reviews of Lumenad?

What Are G2 Users Discussing About Lumenad?

Lumenn AI

Lumenn AI provides a no-code environment for non-technical employees to extract and leverage enterprise data. Through natural language instructions, complex data is transformed into accessible visual graphs with AI-driven insights. Customizable dashboards empower any user to create, manage, and share BI assets.

Who Is the Company Behind Lumenn AI?

Lumenore

Lumenore helps businesses turn data into actionable business intelligence with the power of AI, natural language querying, and predictive analytics. With industry-specific solutions embedded in a powerful BI platform, Lumenore turns your raw data into accurate insights. Ensure seamless data integration, enable modern business storytelling, and encourage advanced insight discovery. Create an all-in-one data universe for effective decision-making across business functions with Lumenore.

Average Rating: 4.5/5.0

Total Reviews: 2

How Do G2 Users Rate Lumenore?

  • Has the product been a good partner in doing business?: 8.3/10 (Category avg: 9.0/10)

Who Is the Company Behind Lumenore?

  • Seller: Netlink
  • Year Founded: 2013
  • HQ Location: Madison Heights, US
  • LinkedIn® Page: www.linkedin.com
    74 employees on LinkedIn®

Who Uses This Product?

  • Company Size: 50% Medium, 50% Small

What Are Lumenore's Pros and Cons?

Pros
  • Analytics (1 reviews)
  • Data Analysis (1 reviews)
  • Data Visualization (1 reviews)
  • Ease of Use (1 reviews)
  • Easy Integrations (1 reviews)
Cons
  • Poor UI (1 reviews)

What Are Recent G2 Reviews of Lumenore?

Lychee AI

Lychee AI is an innovative data visualization platform that simplifies the process of transforming spreadsheets into dynamic, insightful graphs. Designed with user-friendliness in mind, it requires no coding skills, making it accessible to a broad range of users. By focusing on essential features without unnecessary complexities, Lychee AI offers a cost-effective solution for individuals and businesses seeking efficient data analysis and presentation tools. A standout aspect of Lychee AI is its lifetime access model, providing users with all current and future features through a one-time purchase, eliminating the need for monthly subscriptions. Key Features and Functionality: - Instant Graph Generation: Quickly convert spreadsheets into various chart types, including pie, histogram, and bar charts, facilitating immediate data visualization. - No Coding Required: The intuitive interface allows users to create graphs without any programming knowledge, streamlining the data analysis process. - Cost-Effective Solution: With a one-time purchase, users gain lifetime access to the platform, avoiding recurring subscription fees. - Variety of Chart Options: Offers multiple chart types to suit different data representation needs, enhancing the versatility of data presentations. - Efficient Spreadsheet Creation: Enables users to create and manage spreadsheets seamlessly, integrating with the graph generation feature for a cohesive experience. Primary Value and User Solutions: Lychee AI addresses the common challenges associated with data visualization by providing a straightforward, efficient, and affordable tool for converting spreadsheet data into meaningful graphs. It eliminates the need for complex software or coding expertise, making data analysis accessible to a wider audience. The platform's lifetime access model ensures users have a reliable, long-term solution without the burden of ongoing costs. By focusing on essential functionalities, Lychee AI empowers users to present their data effectively, enhancing decision-making processes and communication of insights.

Who Is the Company Behind Lychee AI?

MachEye

MachEye’s augmented analytics platform transforms the way organizations integrate their data, decisions, and operations. While current business intelligence platforms only answer “what” questions on data, MachEye helps users answer “what, why, and how” scenarios for everyone at an organization. Decision makers at any level can now receive actionable insights and recommendations through a “Google like” search experience and “YouTube like” audio-visual experience, in addition to charts and self-service analytics. MachEye adds an actionable “play” button to data! For more information, visit https://www.macheye.com.

Average Rating: 4.7/5.0

Total Reviews: 10

How Do G2 Users Rate MachEye?

  • Has the product been a good partner in doing business?: 8.9/10 (Category avg: 9.0/10)

Who Is the Company Behind MachEye?

  • Seller: MachEye
  • Year Founded: 2018
  • HQ Location: San Jose, US
  • LinkedIn® Page: www.linkedin.com
    11 employees on LinkedIn®

Who Uses This Product?

  • Company Size: 70% Medium, 20% Small

What Are Recent G2 Reviews of MachEye?

What Are G2 Users Discussing About MachEye?

MakePieChart.com

Create professional pie charts easily. Import Excel data, customize colors, and export in multiple formats. No sign up required. Free forever plan available.

Who Is the Company Behind MakePieChart.com?

Metaimpact

Metaimpact (formerly MetaCX) enables organizations to design, build, and deploy digital impact networks where multiple stakeholders can act on shared goals to create collective impact. These networks interconnect, empowering organizations to confront the world's biggest problems like closing the racial wealth gap, improving access to affordable healthcare, meeting workforce needs, and advancing climate solutions.

Average Rating: 4.5/5.0

Total Reviews: 1

Who Is the Company Behind Metaimpact?

Who Uses This Product?

  • Company Size: 100% Small

What Are Recent G2 Reviews of Metaimpact?

What Are G2 Users Discussing About Metaimpact?

Metriclane

Lightweight BI for hybrid CSV + warehouse stacks; built for small data-aware teams.

Who Is the Company Behind Metriclane?

Metrikus

Whether you’re using building data to analyze, visualize or build, the chaotic state of that data is wasting your time, money and other resources. Our solution transforms that chaos into clarity by aggregating and normalizing data from a range of trusted sources and gives you access to exactly what you need. With our web application or via our APIs, you’ll get meaningful insights to help you and your stakeholders make better decisions and focus on the big challenges.

Average Rating: 4.5/5.0

Total Reviews: 1

Who Is the Company Behind Metrikus?

  • Seller: Metrikus LTD
  • Year Founded: 2019
  • HQ Location: London, England, United Kingdom
  • LinkedIn® Page: www.linkedin.com
    15 employees on LinkedIn®

Who Uses This Product?

  • Company Size: 100% Large

What Are Recent G2 Reviews of Metrikus?

Bijou Barry
BB
Researched and written by Bijou Barry
Updated June 24, 2026