Datawalt
Who Is the Company Behind Datawalt?
- Seller: Datawalt
- Year Founded: 2018
- HQ Location: Las Condes, CL
-
LinkedIn® Page: www.linkedin.com
41 employees on LinkedIn®
Total Products under this Category: 762
Last updated: November 01, 2026
Why You Can Trust G2's Software Rankings:
G2's software rankings are built on verified user reviews, rigorous moderation, and a consistent research methodology maintained by a team of analysts and data experts. Each product is measured using the same transparent criteria, with no paid placement or vendor influence. While reviews reflect real user experiences, which can be subjective, they offer valuable insight into how software performs in the hands of professionals. Together, these inputs power the G2 Score, a standardized way to compare tools within every category.
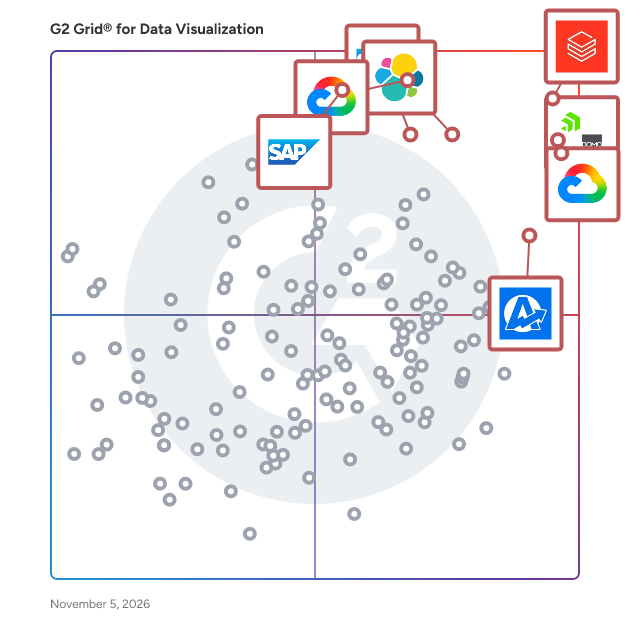
Highlighted products: Databricks, Domo, Looker, Data Studio, Elastic Stack, AgencyAnalytics, SAP HANA Cloud, and SAP Analytics Cloud.
Underlying data: [Grid® JSON](https://www.g2.com/categories/data-visualization-tools/grids.json?focus%5B%5D=databricks&focus%5B%5D=domo&focus%5B%5D=looker&focus%5B%5D=data-studio&focus%5B%5D=elastic-stack&focus%5B%5D=agencyanalytics&focus%5B%5D=sap-hana-cloud-2025-10-01&focus%5B%5D=sap-analytics-cloud)
Design, create & share engaging, reusable, on-brand data stories. Datylon is a data visualization platform for designers and teams to create charts, graphs, reports, dashboards, infographics, and other data-rich visualizations. Create the most captivating on-brand data visualizations right within Adobe Illustrator®. Without coding. Boost your charting power with full freedom of design: add annotations, titles, or any illustration, and create stunning reports, inside the Adobe workflow. Design the most beautiful and engaging report templates and export them to the Datylon web app for the rest of the team to re-use. Datylon gives you full creative control with tons of styling options for charts. Datylon comes with a growing library of fully customizable charts to unleash your full creativity.
Connect G2 to Claude or ChatGPT for answers grounded in G2's trusted reviews, comparisons, and pricing from real user insights.
Daydream offers business intelligence tools crafted for executives managing critical operations.
DigDash is a European software editor of a dynamic dashboard solution and an expert in Business Intelligence. DigDash is a new-generation platform that enables its more than 500 customers and 150,000 users to explore and visualize their data in a simple, non-technical way, enabling them to make more informed business decisions.
DoubleCloud is winding down operations. The company ceased creating new accounts on October 1, 2024, and will completely close on March 1, 2025. DoubleCloud specialized in data analytics infrastructure, offering managed services for open-source data technologies. Throughout its operations, DoubleCloud provided tools for building data pipelines, including solutions for data ingestion, storage, orchestration, ELT, and real-time visualization. The company was committed to helping businesses streamline and optimize their data operations with powerful, open-source-based technologies.
Average Rating: 4.9/5.0
Total Reviews: 4
"Best Managed Service for Kafka and Clickhouse"
Rating: 5.0/5.0 stars
— Adarsh T.
"Cost-effective and reliable managed service for Clickhouse"
Rating: 5.0/5.0 stars
— George P.
Dyntell Bi is a robust visualization, analytics and prediction tool that was born from our ERP solution. Dyntell Bi takes your raw data and makes it come alive. With crystal clear visuals, you can tell the important stories that were buried in the data glut. You can share dashboards and finalized charts in one click. And you can finally turn your information into pure inspiration.
Easy Reports & Data Export is a Built for Shopify app by DevCloud for building custom reports on your store’s orders, products, customers and inventory. Select any fields, apply filters and structure each report the way you need, or describe a report in plain English and let AI generate it instantly. Ready-made templates help you start fast and can be customized as needed. Reports can run automatically on a daily, weekly or monthly schedule and be delivered by email or exported to Google Sheets, Slack, Microsoft Teams, Zapier, Make or SFTP. Every plan includes all features, with pricing based on your Shopify plan (from $4.99/month) and a 7-day free trial.
EMASPHERE is the intelligent data foundation that modern businesses rely on every day. Finance and leadership teams at mid-market and multi-entity companies use EMASPHERE to bring fragmented financial and operational data into one trusted model. The platform connects to accounting, ERP, CRM, HR, payroll, banking and operational systems through 250+ connectors, then collects, cleans and models the data. Business logic, mappings and a semantic layer make sure every figure means the same thing across entities, departments and countries. On that foundation, teams work in four ways: - Explore: ask questions in plain language and analyze validated data with AI. - Structured reporting: KPI definitions, consolidation, validation and historization of each closing. - API: push clean, enriched data to the tools the company already uses. - Forecasting: budgets, forecasts and scenarios that share the same definitions as the actuals. More than 10,000 companies work on the platform, directly and through partners. EMASPHERE has offices in Ghent and Louvain-la-Neuve and serves companies across the Benelux, France and the UK.
Average Rating: 3.0/5.0
Total Reviews: 1
