Best Data Visualization Tools - Page 30

How Many Data Visualization Tools Products Does G2 Track?

Total Products under this Category: 478

Category Stats (Aug 2026)

  • Average Rating: 4.43/5 The average rating of products in this category, based on all submitted ratings
  • Top Trending Product: Supersimple (+0.89%) - Among all products in this category, Supersimple recorded the largest rating increase compared to last month

Last updated: August 04, 2026

How Does G2 Rank Data Visualization Tools Products?

Why You Can Trust G2's Software Rankings:

  • 30 Analysts and Data Experts
  • 26,100+ Authentic Reviews
  • 478+ Products
  • Unbiased Rankings

G2's software rankings are built on verified user reviews, rigorous moderation, and a consistent research methodology maintained by a team of analysts and data experts. Each product is measured using the same transparent criteria, with no paid placement or vendor influence. While reviews reflect real user experiences, which can be subjective, they offer valuable insight into how software performs in the hands of professionals. Together, these inputs power the G2 Score, a standardized way to compare tools within every category.

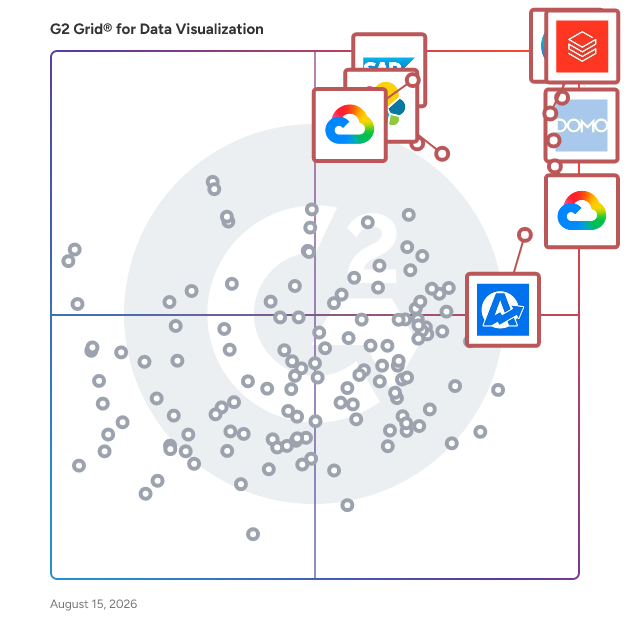
G2 Grid® for Data Visualization Tools

G2 Grid® for Data Visualization Tools plotting products by satisfaction and market presence

Highlighted products: Canva, Databricks, Domo, Looker, Data Studio, Elastic Stack, SAP HANA Cloud, and AgencyAnalytics.

Underlying data: [Grid® JSON](https://www.g2.com/categories/data-visualization-tools/grids.json?focus%5B%5D=canva&focus%5B%5D=databricks&focus%5B%5D=domo&focus%5B%5D=looker&focus%5B%5D=data-studio&focus%5B%5D=elastic-stack&focus%5B%5D=sap-hana-cloud-2025-10-01&focus%5B%5D=agencyanalytics)

Sponsored

Meltwater

Meltwater empowers companies with a suite of solutions that spans media, social, and consumer intelligence. Since 2001, we’ve helped organizations harness the world’s data in real time to fuel smarter decisions, stronger performance and sustainable growth. By analyzing nearly 1 billion pieces of content each day and transforming them into vital insights, Meltwater unlocks the competitive edge needed to drive results. With 27,000 customers, 50 offices across six continents and 2,200 employees, Meltwater is the industry partner of choice for global brands making an impact. We activate the power of data so businesses can make smarter, faster decisions. With the most robust dataset across media, social, consumer trends – and now insights into how large language models (LLMs) shape brand visibility – we give companies a complete view of the conversations, behaviors, and signals influencing their markets. Our powerful AI turns this breadth of data into actionable insights, empowering teams across PR, communications and marketing to confidently drive strategy. -- Mira Studio (AI-Powered Media, Market, and Brand Intelligence Assistant) Key features - Natural language querying - Automated insights - Structured reports - Trend-spotting and explanations with suggested actions - Integrated throughout the full Meltwater Platform - Integrates with Copilot and Slack What is Mira Studio? Mira Studio is Meltwater’s conversational AI teammate for media, market, and brand intelligence. Mira Studio helps PR, comms, and marketing teams cut through complexity and reduce time spent on manual analysis, with prompt-driven reporting, briefing, simplified data exploration, and real-time answers. Who uses Mira Studio? Teams that need quick and shareable insights while reducing manual time spent digging through data. Mira Studio converts Meltwater data into summaries, visuals, and provides explanations through natural language interaction. Get to the why of what’s happening, not just the what. -- Media Intelligence for PR (Media Monitoring and Analysis Platform) Key capabilities - Monitor 6M different media sources - Unlimited search - Real-time alerts - Journalist identification - Competitive benchmarking - Unified, shareable reporting - Predictive analytics for mention forecasting - Brand-level sentiment What is Meltwater Media Intelligence? Meltwater’s media intelligence platform monitors and analyzes earned media coverage through tracking brand mentions and narratives across news, print, broadcast, podcasts, and social media. This enables faster response times to trends or feedback through real-time awareness of message penetration, emerging risks, and consumer sentiment. Who Uses Meltwater Media Intelligence? PR and comms teams use Meltwater Media Intelligence to strengthen PR strategies with accurate measurement of brand impact across media sources. With journalist outreach capabilities within a single platform, PR efforts are streamlined for better results. -- Social Listening and Analytics Key capabilities - Monitoring 200B+ social conversations - Analysis of 300M+ social profiles - Influencer identification - Shareable reporting across earned, owned, and paid social - Brand-level sentiment and predictive analytics for brand measurement and forecasting - AI agents for Boolean search creation and management - AI-powered insights summarize brand and topic narratives - Access to Meltwater API What is Meltwater Social Listening and Analytics? Meltwater social listening and analytics is an integrated platform providing monitoring and AI-powered analysis for billions of social conversations. Connect consumer insights to social strategy and marketing campaigns for a seamless approach to brand promotion, quicker crisis response, and powerful competitor insights without data caps. Who uses Meltwater Social Listening? Marketing and social teams in charge of consumer, competitor, and industry insights. -- Influencer Management (Klear – Influencer Relationship Management Platform) Key capabilities - Database of 30M+ global creator profiles - AI-driven influencer discovery and recommendations - Influencer vetting and brand safety analysis - AI-driven outreach and relationship management - Campaign management and creator collaboration tools - Performance benchmarking and ROI tracking - Competitive influencer intelligence What is our influencer management solution? Klear is Meltwater’s influencer discovery and influencer relationship management solution. Vet, manage, and measure influencers and campaigns at scale from within a single tool. AI-powered influencer recommendations improves targeting accuracy, providing better matches and influencing better ROI. Who uses our influencer management solution? Marketing, PR, and Influencer teams use Klear for implementing and scaling their influencer campaigns. Outreach, gifting, payment, analysis and reporting can all be managed through our platform. -- Enterprise and Professional Services Key capabilities - Analyst-led insights and reporting - Custom data configurations - Enterprise-grade support and delivery What is Meltwater Enterprise and Professional Services? Customized intelligence solutions and professional services from Meltwater experts supports large enterprises with advanced or bespoke requirements. This service provides complex data analysis and reporting that go beyond standard product workflows, and ensures fast and accurate delivery for high-stakes or large-scale intelligence needs.

Visit website

OQLIS

OQLIS is a data visualization and analytics platform designed to translate data into insights, deployed in the cloud.

Who Is the Company Behind OQLIS?

  • Seller: OQLIS Software
  • Year Founded: 2014
  • HQ Location: City of Tshwane, ZA
  • Twitter: @OQAnalytics
    46 Twitter followers
  • LinkedIn® Page: www.linkedin.com
    17 employees on LinkedIn®

ProActive Alert

A solution that continuously analyses key operational data in real-time against your predetermined metrics. Instantly alerting business prior to any customer impact.

Who Is the Company Behind ProActive Alert?

Profitbase InFront

Profitbase InFront is a web-based dashboard solution that enables users to view, explore, and analyze data directly from a browser on any device, including mobile phones, desktops, and tablets. Designed with an intuitive interface, it requires no training and can be customized to align with a company's visual identity. Key Features and Functionality: - Web-Based Accessibility: Access dashboards from any device with a web browser, ensuring flexibility and convenience. - User-Friendly Interface: Navigate and interact with data effortlessly, without the need for specialized training. - Customization: Tailor the dashboard's appearance to match the company's branding and visual preferences. Primary Value and Problem Solved: Profitbase InFront addresses the challenge of complex and inaccessible data analysis tools by providing a straightforward, web-based dashboard that simplifies data exploration and visualization. This empowers users across the organization to make informed decisions quickly, without the barriers of technical complexity or extensive training.

Who Is the Company Behind Profitbase InFront?

QCEO Dashboard

QCEO visualizes your business data and tracks the health of your business by measuring revenue trends, growth, and operational cash flow. For many CEOs, their dashboards are mission control and a window into understanding the daily operations and growth of their businesses. Busy executives are looking for quick and high-level visibility into their businesses, the ability to pinpoint areas of improvement, and actionable data to help drive business actions. With all these high-level metrics in place, CEOs are better equipped to drive the business forward.

Who Is the Company Behind QCEO Dashboard?

  • Seller: CloudQ
  • Year Founded: 2013
  • HQ Location: Alpharetta, US
  • LinkedIn® Page: www.linkedin.com
    180 employees on LinkedIn®

QuickChart

QuickChart is a chart API that lets you display image charts anywhere, including email and reports. Use QuickChart to generate image charts, PDFs, QR codes, and more.

Who Is the Company Behind QuickChart?

Quick Filters for Jira Dashboards

Quick Filters for Jira Dashboards turns static dashboards into interactive, insight‑driven control centers. Teams can instantly slice and refine any chart, table, or diagram with powerful real‑time filters - no admin rights or duplicate dashboards needed. It’s a fast, intuitive way to surface the right data at the right moment and keep every team aligned on what matters most. Why Teams Love It: - See only what matters: Instantly narrow any dashboard to the projects, people, or work items you care about. - Work faster with less noise: One dashboard adapts to every audience - no more cluttered or duplicated views. - Find answers on the fly: Real‑time filters help you spot bottlenecks, trends, and priorities in seconds. - Empower everyone: Anyone can explore data interactively without admin rights or complex setup. Perfect For: - Teams that want dashboards to adjust to their workflow, not the other way around - Leaders who need quick drill‑downs during reviews or status updates - Cross‑project teams looking for a single, flexible source of truth - Anyone who wants clearer insights without building endless dashboards

Who Is the Company Behind Quick Filters for Jira Dashboards?

RasXP

Rasello is a cloud enterprise software solutions company with Software as a Service (SaaS) and Platform as a Service (PaaS).

Who Is the Company Behind RasXP?

  • Seller: Rasello
  • Year Founded: 2011
  • HQ Location: Masaki, TZ
  • LinkedIn® Page: www.linkedin.com
    15 employees on LinkedIn®

Reportabl.io

Reportabl is a Cloud based data platform and reporting solution for Small to Medium sized organisation. We specialise in data and reporting for Health, Accounting and Sports Organisations.

Who Is the Company Behind Reportabl.io?

Reporting Studio

With Reporting Studio, your visualized business report is just a few clicks away. Create professional management reports, presentations and interactive dashboards in no time at all with Reporting Studio. Thanks to its intelligent recognition of business data and context, the tool instantly recommends the best visualizations for your business figures, turning them into clear, compelling graphics. Transform these visualizations from the generated charts and tables into easy-to-understand analyses and comprehensive business reports – complete with highlighting, comments and key messages – with just a few clicks. Reporting Studio is IBCS®-certified and automatically applies globally recognized best practices in business communication, which ensure clarity and comprehensibility in business reporting.

Who Is the Company Behind Reporting Studio?

Satori Reporting

Satori Reporting is a pre-built data model/data-warehouse for ERP systems: specifically NetSuite at the moment.

Who Is the Company Behind Satori Reporting?

Scaylr

Scaylr is a mockup generator designed to streamline the creation of high-quality product images for online sellers. It enables users to produce professional mockups efficiently, enhancing product presentations without the need for complex software. Key Features and Functionality: - Batch Mockup Generation: Create multiple mockups simultaneously, saving time and effort. - Custom Template Support: Upload and utilize your own PSD templates, offering flexibility and personalization. - Export Options: Supports PNG and JPEG formats for versatile use across various platforms. - Template Library: Access a free library of templates to kickstart your mockup creation. - Bulk Download Capability: Efficiently download multiple mockups in ZIP format, streamlining workflow. - No Watermarks on Paid Plans: Ensure clean, professional outputs without watermarks on Starter and Pro plans. Primary Value and User Solutions: Scaylr addresses the challenges online sellers face in producing appealing product images by offering an intuitive and efficient mockup generation tool. It eliminates the need for advanced design skills or expensive software, enabling users to create professional-quality mockups quickly. This enhances product listings, attracts customers, and ultimately boosts sales. With scalable pricing plans, Scaylr caters to both emerging entrepreneurs and established businesses, supporting growth and adaptability in the competitive e-commerce landscape.

Who Is the Company Behind Scaylr?

Shift4 Business Intelligence

Shift4's Business Intelligence platform is a comprehensive solution designed to empower businesses by transforming transaction data into actionable insights. By integrating advanced reporting capabilities, it enables organizations to optimize operations, monitor real-time transaction data, and make informed decisions that drive growth and efficiency. Key Features and Functionality: - Real-Time Transaction Monitoring: Track successful and failed payments, refunds, chargebacks, and more, providing immediate visibility into financial activities. - Advanced Reporting and Analytics: Utilize detailed reports to assess business performance, identify sales trends, and make data-driven decisions. - Customer Insights: Gain a comprehensive understanding of customer payment preferences and purchasing behaviors to tailor services effectively. - Unified Payments Data: Seamlessly integrate online and offline payment data for a holistic view of the entire commerce landscape. - API Integration: Incorporate transaction data and reporting functionalities directly into existing systems, ensuring access to precise data when needed. - Comprehensive Reporting: Generate detailed reports on transactions, service fees, chargeback activities, and adjustments to maintain financial transparency. - Fraud Monitoring: Implement robust tools to detect and prevent fraudulent activities, safeguarding the business and its customers. - Employee Scheduling: Manage staff schedules efficiently with integrated calendar and shift management tools. - Customer Engagement: Enhance customer loyalty through built-in marketing tools that facilitate welcome emails and promotional offers. - Online Reputation Management: Monitor and respond to customer reviews across multiple platforms to maintain and improve brand reputation. - Social Media Management: Schedule posts, track content performance, and manage all social media accounts from a centralized platform. Primary Value and Solutions Provided: Shift4's Business Intelligence platform addresses the critical need for businesses to harness their transaction data effectively. By offering real-time monitoring, advanced analytics, and comprehensive reporting, it enables organizations to: - Optimize Operations: Streamline administrative tasks, allowing more focus on core business activities. - Enhance Decision-Making: Utilize data-driven insights to make informed strategic decisions. - Improve Customer Relationships: Understand and cater to customer preferences, fostering loyalty and satisfaction. - Ensure Financial Transparency: Maintain clear and accurate financial records to support auditing and compliance requirements. By integrating these capabilities, Shift4's Business Intelligence platform empowers businesses to work smarter, not harder, driving growth and success in a competitive marketplace.

Who Is the Company Behind Shift4 Business Intelligence?

  • Seller: Shift4
  • HQ Location: Center Valley, Pennsylvania
  • LinkedIn® Page: www.linkedin.com
    2,520 employees on LinkedIn®

simplebi

Enhance your current suite of products and improve your clients ability to do reporting.

Who Is the Company Behind simplebi?

Who Uses This Product?

  • Company Size: 100% Small

SKOOR

SKOOR GmbH offers a scalable, customizable KPI dashboard solution tailored for businesses seeking flexible performance management. Designed to integrate seamlessly with diverse data sources and existing systems, SKOOR eliminates the need for workflow adjustments while delivering real-time analytics, AI-driven insights, and predictive forecasting. Its user-friendly platform features highly customizable dashboards, real-time monitoring, and automated alerts, supporting informed decision-making and efficient business processes. Ideal for complex reporting, including ESG and cash management, SKOOR adapts effortlessly to any size organization, enhancing data-driven strategies for growth and sustainability.

Who Is the Company Behind SKOOR?

  • Seller: Skoor
  • Year Founded: 2001
  • HQ Location: Wallisellen, CH
  • LinkedIn® Page: www.linkedin.com
    13 employees on LinkedIn®
Bijou Barry
BB
Researched and written by Bijou Barry
Updated June 24, 2026