Best Data Visualization Tools - Page 29

How Many Data Visualization Tools Products Does G2 Track?

Total Products under this Category: 478

Category Stats (Aug 2026)

  • Average Rating: 4.43/5 The average rating of products in this category, based on all submitted ratings
  • Top Trending Product: Supersimple (+0.89%) - Among all products in this category, Supersimple recorded the largest rating increase compared to last month

Last updated: August 04, 2026

How Does G2 Rank Data Visualization Tools Products?

Why You Can Trust G2's Software Rankings:

  • 30 Analysts and Data Experts
  • 26,100+ Authentic Reviews
  • 478+ Products
  • Unbiased Rankings

G2's software rankings are built on verified user reviews, rigorous moderation, and a consistent research methodology maintained by a team of analysts and data experts. Each product is measured using the same transparent criteria, with no paid placement or vendor influence. While reviews reflect real user experiences, which can be subjective, they offer valuable insight into how software performs in the hands of professionals. Together, these inputs power the G2 Score, a standardized way to compare tools within every category.

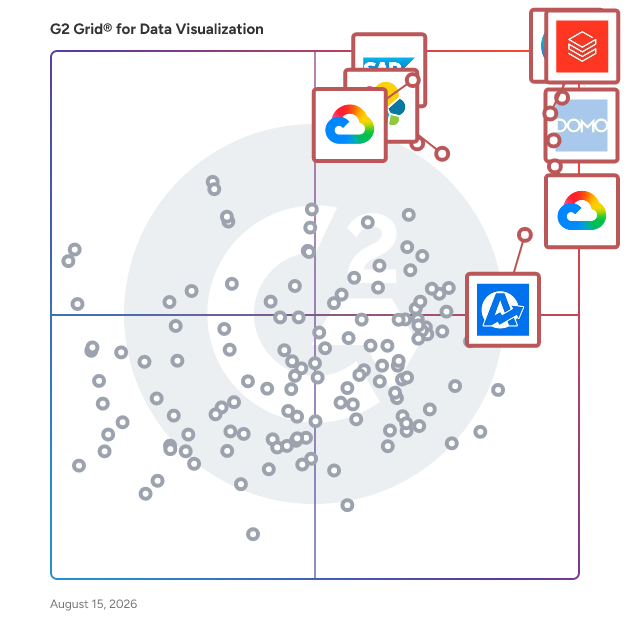
G2 Grid® for Data Visualization Tools

G2 Grid® for Data Visualization Tools plotting products by satisfaction and market presence

Highlighted products: Canva, Databricks, Domo, Looker, Data Studio, Elastic Stack, SAP HANA Cloud, and AgencyAnalytics.

Underlying data: [Grid® JSON](https://www.g2.com/categories/data-visualization-tools/grids.json?focus%5B%5D=canva&focus%5B%5D=databricks&focus%5B%5D=domo&focus%5B%5D=looker&focus%5B%5D=data-studio&focus%5B%5D=elastic-stack&focus%5B%5D=sap-hana-cloud-2025-10-01&focus%5B%5D=agencyanalytics)

Sponsored

Meltwater

Meltwater empowers companies with a suite of solutions that spans media, social, and consumer intelligence. Since 2001, we’ve helped organizations harness the world’s data in real time to fuel smarter decisions, stronger performance and sustainable growth. By analyzing nearly 1 billion pieces of content each day and transforming them into vital insights, Meltwater unlocks the competitive edge needed to drive results. With 27,000 customers, 50 offices across six continents and 2,200 employees, Meltwater is the industry partner of choice for global brands making an impact. We activate the power of data so businesses can make smarter, faster decisions. With the most robust dataset across media, social, consumer trends – and now insights into how large language models (LLMs) shape brand visibility – we give companies a complete view of the conversations, behaviors, and signals influencing their markets. Our powerful AI turns this breadth of data into actionable insights, empowering teams across PR, communications and marketing to confidently drive strategy. -- Mira Studio (AI-Powered Media, Market, and Brand Intelligence Assistant) Key features - Natural language querying - Automated insights - Structured reports - Trend-spotting and explanations with suggested actions - Integrated throughout the full Meltwater Platform - Integrates with Copilot and Slack What is Mira Studio? Mira Studio is Meltwater’s conversational AI teammate for media, market, and brand intelligence. Mira Studio helps PR, comms, and marketing teams cut through complexity and reduce time spent on manual analysis, with prompt-driven reporting, briefing, simplified data exploration, and real-time answers. Who uses Mira Studio? Teams that need quick and shareable insights while reducing manual time spent digging through data. Mira Studio converts Meltwater data into summaries, visuals, and provides explanations through natural language interaction. Get to the why of what’s happening, not just the what. -- Media Intelligence for PR (Media Monitoring and Analysis Platform) Key capabilities - Monitor 6M different media sources - Unlimited search - Real-time alerts - Journalist identification - Competitive benchmarking - Unified, shareable reporting - Predictive analytics for mention forecasting - Brand-level sentiment What is Meltwater Media Intelligence? Meltwater’s media intelligence platform monitors and analyzes earned media coverage through tracking brand mentions and narratives across news, print, broadcast, podcasts, and social media. This enables faster response times to trends or feedback through real-time awareness of message penetration, emerging risks, and consumer sentiment. Who Uses Meltwater Media Intelligence? PR and comms teams use Meltwater Media Intelligence to strengthen PR strategies with accurate measurement of brand impact across media sources. With journalist outreach capabilities within a single platform, PR efforts are streamlined for better results. -- Social Listening and Analytics Key capabilities - Monitoring 200B+ social conversations - Analysis of 300M+ social profiles - Influencer identification - Shareable reporting across earned, owned, and paid social - Brand-level sentiment and predictive analytics for brand measurement and forecasting - AI agents for Boolean search creation and management - AI-powered insights summarize brand and topic narratives - Access to Meltwater API What is Meltwater Social Listening and Analytics? Meltwater social listening and analytics is an integrated platform providing monitoring and AI-powered analysis for billions of social conversations. Connect consumer insights to social strategy and marketing campaigns for a seamless approach to brand promotion, quicker crisis response, and powerful competitor insights without data caps. Who uses Meltwater Social Listening? Marketing and social teams in charge of consumer, competitor, and industry insights. -- Influencer Management (Klear – Influencer Relationship Management Platform) Key capabilities - Database of 30M+ global creator profiles - AI-driven influencer discovery and recommendations - Influencer vetting and brand safety analysis - AI-driven outreach and relationship management - Campaign management and creator collaboration tools - Performance benchmarking and ROI tracking - Competitive influencer intelligence What is our influencer management solution? Klear is Meltwater’s influencer discovery and influencer relationship management solution. Vet, manage, and measure influencers and campaigns at scale from within a single tool. AI-powered influencer recommendations improves targeting accuracy, providing better matches and influencing better ROI. Who uses our influencer management solution? Marketing, PR, and Influencer teams use Klear for implementing and scaling their influencer campaigns. Outreach, gifting, payment, analysis and reporting can all be managed through our platform. -- Enterprise and Professional Services Key capabilities - Analyst-led insights and reporting - Custom data configurations - Enterprise-grade support and delivery What is Meltwater Enterprise and Professional Services? Customized intelligence solutions and professional services from Meltwater experts supports large enterprises with advanced or bespoke requirements. This service provides complex data analysis and reporting that go beyond standard product workflows, and ensures fast and accurate delivery for high-stakes or large-scale intelligence needs.

Visit website

Leonardo

Leonardo is a visualization, web spreadsheet, and dashboarding analysis tool developed by PARIS Technologies. Leonardo is the ideal complement to a centralized data management system such as Olation, allowing users to gain valuable insights from their data. With a user-friendly interface, it enables individuals and teams to create stunning visualizations and interactive dashboards that facilitate data exploration and storytelling. The tool seamlessly connects to the centralized data management system, pulling data from various sources and automatically updating visualizations in real-time. effectively communicates trends, patterns, and relationships within the data. Users can easily filter and drill-down into the data, providing deeper analysis and uncovering hidden insights. Collaboration features allow for sharing and collaboration of visualizations, enabling stakeholders to access and interact with updated data visualizations anytime, anywhere. This visualization tool is ideal for data analysts, business analysts, and decision-makers who rely on data-driven insights to guide their strategic decisions. It empowers users to understand complex data through intuitive visual representations and facilitates data-driven storytelling for persuasive presentations and reports. With seamless integration with the centralized data management system, this visualization tool enhances the value of the data, enabling users to extract actionable insights and drive informed decision-making.

Who Is the Company Behind Leonardo?

LivChart

LivChart is an AI-assisted business intelligence and analytics platform that helps teams turn operational data into interactive dashboards, charts, reports, and actionable insights. It combines data onboarding, ETL, query building, dashboard design, alerting, and governed user access in a single workspace. With LivChart, teams can connect files, databases, and web service data sources; prepare and enrich datasets in DataStudio; build reusable query and semantic layers; and create dashboards with charts, KPIs, filters, pivots, grids, drill-downs, forecasts, radar signals, and AI-generated insights. Users can explore data through interactive dashboards, create personal charts with the AI Chart Wizard, work in an Excel-like Analytics Studio, export PDF reports, send email summaries, define threshold-based alarms, and share dashboards, charts, or workbooks securely. LivChart is designed for organizations that need more than static reporting. It supports both admin-governed system dashboards and personal analytical workspaces, with subject-based permissions, role management, device binding, scheduled tasks, plugin-based data enrichment, and health checks for operational reliability. Its AI features assist with chart generation, dashboard insights, workbook actions, and exploratory analysis while keeping data preparation, review, and governance under user and admin control.

Who Is the Company Behind LivChart?

Lumenn AI

Lumenn AI provides a no-code environment for non-technical employees to extract and leverage enterprise data. Through natural language instructions, complex data is transformed into accessible visual graphs with AI-driven insights. Customizable dashboards empower any user to create, manage, and share BI assets.

Who Is the Company Behind Lumenn AI?

MakePieChart.com

Create professional pie charts easily. Import Excel data, customize colors, and export in multiple formats. No sign up required. Free forever plan available.

Who Is the Company Behind MakePieChart.com?

Mr. Dashboard

Improve your business reporting and get better business insight with excel dashboard

Who Is the Company Behind Mr. Dashboard?

MUI X Charts

A fast and extendable library of react chart components for data visualization. MUI X is a collection of advanced React UI components for complex use cases. Use the native integration with Material UI or extend your design system. They feature state-of-the-art functionality and complex UX workflows for data-rich applications and support a wide range of use cases.

Who Is the Company Behind MUI X Charts?

  • Seller: MUI
  • Year Founded: 2019
  • HQ Location: Paris, TF
  • Twitter: @MUI_hq
    18,727 Twitter followers
  • LinkedIn® Page: www.linkedin.com
    82 employees on LinkedIn®

MUI X Data Grid

A fast and extensible React data table and React data grid, with filtering, sorting, aggregation, and more. The MUI X Data Grid is a TypeScript-based React component that presents information in a structured format of rows and columns. It provides developers with an intuitive API for implementing complex use cases; and end users with a smooth experience for manipulating an unlimited set of data.

Average Rating: 4.3/5.0

Total Reviews: 3

Who Is the Company Behind MUI X Data Grid?

  • Seller: MUI
  • Year Founded: 2019
  • HQ Location: Paris, TF
  • Twitter: @MUI_hq
    18,727 Twitter followers
  • LinkedIn® Page: www.linkedin.com
    82 employees on LinkedIn®

Who Uses This Product?

  • Company Size: 100% Medium

What Are Recent G2 Reviews of MUI X Data Grid?

NationGraph

Public sector sales intelligence that surfaces buying signals before the RFP drops. NationGraph is built for companies selling to state and local government, K–12, and higher education. Most vendors find out about an opportunity once it's already public, when the requirements are set and an incumbent is favored. NationGraph reads millions of board minutes, budgets, grants, and contracts across 110,000 agencies to flag which buyers are moving toward a purchase 6 to 18 months before the RFP drops. Every account comes with the signals behind it and verified decision-maker contacts, giving your whole team walk-the-halls awareness of their territory: expiring contracts, new funding, and pain points raised in council and board meetings. Prioritize the right accounts, reach the right people, and show up as the expert in the room before your competitors know the deal exists.

Who Is the Company Behind NationGraph?

NetMiner

NetMiner 5 is an advanced analytics platform developed by CYRAM Inc. that combines graph theory, machine learning, and AI to analyze, visualize, and interpret network and text data. Designed for researchers, analysts, and decision-makers across academia, government, and industry, NetMiner helps users uncover complex relational and textual patterns without requiring any programming expertise. At its core, NetMiner is built around social network analysis (SNA), enabling the structural exploration of relationships between people, organizations, documents, and concepts. It supports one-mode, two-mode, and multiplex networks, and provides a wide range of SNA metrics from basic to advanced to assess individual centrality, group dynamics, and whole-network structure. NetMiner goes beyond traditional SNA by integrating machine learning (ML) and graph neural networks (GNNs). Users can easily apply supervised and unsupervised learning techniques such as classification, regression, and clustering, as well as GNN models like GCN, GraphSAGE, and GAT, for predictive modeling. In terms of text analysis, NetMiner offers powerful capabilities to extract keywords, build co-occurrence networks, generate word clouds, and perform topic modeling using LDA. This allows users to move beyond frequency-based analysis and explore the latent meaning structure in large text corpora. NetMiner includes a powerful interactive 2D visualization engine that makes network structure exploration intuitive. Nodes and links can be styled by centrality, frequency, or categories, and users can zoom, filter, and drag to explore key actors and patterns. These visualizations are directly linked to the data for accurate interpretation. Even with large datasets, dynamic visual analysis is possible without writing code. The built-in AI Assistant, powered by LLMs like GPT and Gemini, helps interpret results and suggests next steps—making it accessible even to users who are new to network or text analysis. NetMiner is widely used across fields including: - Academic research: sociology, communication, political science, digital humanities, education - Policy analysis and public sector planning: stakeholder mapping, policy network evaluation, community structure detection - Enterprise analysis: internal communication auditing, compliance monitoring, customer segmentation, influencer analysis - Media and social media analysis: opinion leader detection, information diffusion, discourse analysis - Cybersecurity and anomaly detection: email network analysis, abnormal behavior pattern identification NetMiner supports importing and exporting various file formats (CSV, Excel) and integrates with external tools via APIs and scripting. Licenses are available for students, educational institutions (schools), and organizations/corporations. More than just a network visualization tool, NetMiner is a complete analysis environment built on the foundation of network thinking. It helps users move from data to insight to action—faster, smarter, and with greater clarity. To learn more or request a demo, visit www.netminer.com

Average Rating: 4.5/5.0

Total Reviews: 1

Who Is the Company Behind NetMiner?

  • Seller: NetMiner
  • Year Founded: 2000
  • HQ Location: Gyeonggi-do, South Korea
  • Twitter: @netminer
    230 Twitter followers
  • LinkedIn® Page: www.linkedin.com
    1 employees on LinkedIn®

Who Uses This Product?

  • Company Size: 100% Small

What Are Recent G2 Reviews of NetMiner?

NOORAI Platform

NOORAI is an AI-powered decision intelligence platform that helps organizations turn complex, fragmented data into clear, confident decisions. We unify enterprise and external data into a single environment, enabling teams to interact with their data conversationally, generate real-time insights, and move from analysis to action faster. With NOORAI, organizations can: - Integrate data across systems, APIs, files, and external sources - Interact using natural language - Generate AI-driven insights, dashboards, and reports - Forecast outcomes and run “what-if” scenarios - Assess the impact of market shifts, inflation, and macroeconomic trends on business performance - Automate analytics and decision workflows within a secure, enterprise-grade platform

Who Is the Company Behind NOORAI Platform?

  • Seller: NOORAI
  • Year Founded: 2024
  • HQ Location: Boston , US
  • LinkedIn® Page: www.linkedin.com
    11 employees on LinkedIn®

Nucleus Analytics

Nucleus is for everyone, from the marketing intern to the executive director. With its customizable reports and deeper levels of analysis, Nucleus is equipped to answer all your data questions.

Who Is the Company Behind Nucleus Analytics?

Nveil AI

Nveil AI is an explainable AI platform that transforms raw data into production-ready, interactive visualizations — without writing a single line of code. Upload a CSV, Excel, JSON, or medical imaging file, describe what you need in plain language, and Nveil generates charts, dashboards, 3D renderings, heatmaps, and more in seconds. Unlike traditional data visualization tools that require mastering Python, R, or complex BI software, Nveil removes the technical barrier entirely. Its natural language interface lets researchers, analysts, healthcare professionals, and business teams go from raw dataset to actionable insight in a single conversation. No setup, no configuration, no learning curve. What sets Nveil apart is its deterministic AI architecture. While most AI-powered analytics tools rely on probabilistic language models prone to hallucinations, Nveil's proprietary engine — Choregraph™ — orchestrates every pipeline with verifiable, reproducible mathematics. Every visualization is explainable and auditable, making it suitable for regulated industries like healthcare, finance, and scientific research. Key capabilities include no-code data visualization with drag-and-drop support for CSV, XLSX, JSON, DICOM, and MHD formats; interactive exploration with pan, hover, and parameter adjustment on charts, maps, networks, scatter plots, volumetric renderings, and surfaces; large-scale data handling for datasets of several gigabytes; export flexibility to images, PDFs, or embeddable HTML; real-time collaboration across devices; and data privacy by design — Nveil never uses your data to train its models. Nveil serves a wide range of use cases: from medical imaging reconstruction and tumor evolution simulation to fraud detection, Benford's Law analysis, and cross-sectional dataset exploration. Backed by years of research from TIMC Lab and Université Grenoble Alpes, the platform bridges the gap between academic rigor and business-ready analytics. Whether you're a data scientist looking to accelerate exploratory analysis, a researcher who needs reproducible visualizations for publication, or a business team tracking KPIs without waiting on IT — Nveil AI delivers instant, trustworthy, and beautiful data storytelling.

Who Is the Company Behind Nveil AI?

  • Seller: Nveil
  • Year Founded: 2023
  • HQ Location: Grenoble, FR
  • LinkedIn® Page: www.linkedin.com
    4 employees on LinkedIn®

Odoo Dashboards

Build stunning dashboards directly inside your Odoo workspace - no coding, no exports, no external tools. Just pick your data, drag your charts, and share insights with your team in minutes.

Who Is the Company Behind Odoo Dashboards?

Ollagraph

Landing page introducing Ollagraph and its web data APIs for AI applications and automation.

Who Is the Company Behind Ollagraph?

OpenText Intelligence

OpenText™ Magellan™ BI & Reporting embeds compelling reports and dashboards into enterprise applications to increase their value and improve decision-making. With Magellan BI & Reporting, IT teams can leverage capabilities, such as embeddability, security and scalability to address virtually any reporting and dashboarding requirement.

Who Is the Company Behind OpenText Intelligence?

  • Seller: OpenText
  • Year Founded: 1991
  • HQ Location: Waterloo, ON
  • Twitter: @OpenText
    21,565 Twitter followers
  • LinkedIn® Page: www.linkedin.com
    23,048 employees on LinkedIn®
  • Ownership: NASDAQ:OTEX
Bijou Barry
BB
Researched and written by Bijou Barry
Updated June 24, 2026