Best Data Visualization Tools - Page 29

How Many Data Visualization Tools Products Does G2 Track?

Total Products under this Category: 762

Category Stats (Nov 2026)

  • Average Rating: 4.44/5 The average rating of products in this category, based on all submitted ratings
  • Top Trending Product: Upsolve AI (+1.75%) - Among all products in this category, Upsolve AI recorded the largest rating increase compared to last month

Last updated: November 01, 2026

How Does G2 Rank Data Visualization Tools Products?

Why You Can Trust G2's Software Rankings:

  • 30 Analysts and Data Experts
  • 22,900+ Authentic Reviews
  • 762+ Products
  • Unbiased Rankings

G2's software rankings are built on verified user reviews, rigorous moderation, and a consistent research methodology maintained by a team of analysts and data experts. Each product is measured using the same transparent criteria, with no paid placement or vendor influence. While reviews reflect real user experiences, which can be subjective, they offer valuable insight into how software performs in the hands of professionals. Together, these inputs power the G2 Score, a standardized way to compare tools within every category.

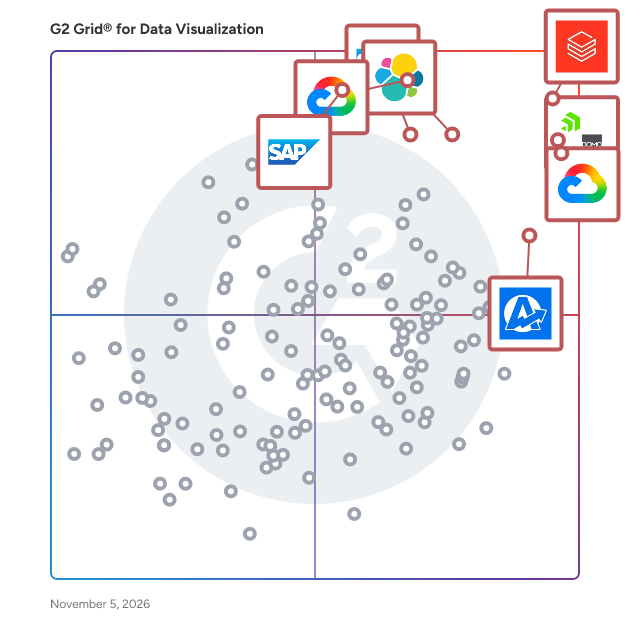
G2 Grid® for Data Visualization Tools

G2 Grid® for Data Visualization Tools plotting products by satisfaction and market presence

Highlighted products: Databricks, Domo, Looker, Data Studio, Elastic Stack, AgencyAnalytics, SAP HANA Cloud, and SAP Analytics Cloud.

Underlying data: [Grid® JSON](https://www.g2.com/categories/data-visualization-tools/grids.json?focus%5B%5D=databricks&focus%5B%5D=domo&focus%5B%5D=looker&focus%5B%5D=data-studio&focus%5B%5D=elastic-stack&focus%5B%5D=agencyanalytics&focus%5B%5D=sap-hana-cloud-2025-10-01&focus%5B%5D=sap-analytics-cloud&segment=all)

ChartForgeAI

ChartForgeAI is an automated data visualization platform that uses AI to transform raw data into professional, presentation-ready charts and insights in seconds.

Who Is the Company Behind ChartForgeAI?

ChartGPT

Bring clarity to your numbers with ChartGPT. This AI-powered chart maker helps transform everyday data into clean, engaging and easy-to-understand visualizations. Simply provide your information and describe the result you need to create charts for presentations, reports, research and analysis. Built for professionals, teams, marketers, researchers and students, ChartGPT reduces manual chart work and makes communicating valuable data insights simpler and more efficient.

Who Is the Company Behind ChartGPT?

AI can help you find the answers. G2 helps you trust them.

Connect G2 to Claude or ChatGPT for answers grounded in G2's trusted reviews, comparisons, and pricing from real user insights.

How it works

Chartlr

Chartlr lets users convert the excel tables or spreadsheet data into different charts and graphs.

Who Is the Company Behind Chartlr?

Chartmeister

Chartmeister is a browser-based waterfall chart editor for business presentations and data analysis. Start with an editable example, change the chart’s values and appearance, and export your work. It provides a focused workflow for creating waterfall charts without setting up a full business intelligence platform.

Who Is the Company Behind Chartmeister?

ChartPixel

Uncover hidden trends and patterns in your data with ChartPixel's AI-assisted insights and visualization engine, offering powerful statistics without the learning curve. - Get the most important data insights explained and visualized in seconds. - Forecast relevant business insights and ensure statistical significance to make better decisions - Gain expert survey insights with sentiment and topic analysis.

Who Is the Company Behind ChartPixel?

Chart-Tank

Chart-Tank is a PowerPoint and Excel charting software. It offers a wide range of highly customizable chart types, data annotations, and other enhancements. Its user-friendly interface ensures that even new users can quickly become proficient with the software and craft charts with minimal effort. Chart-Tank is particularly suitable for professionals who need high-quality, impactful charts for presentations and reports. Some of its features include: 1. Chart Variety: Chart-Tank supports numerous chart types, including stacked and cluster bar charts, waterfall charts, bar Mekko and Marimekko charts, pie and doughnut charts, bubble and scatter charts, box and whisker graphs, and more. The software supports advanced features like data rows, data columns, value lines, vertical lines, growth lines with automated CAGR calculation, bar comparison lines, segment comparison lines, and linked Excel workbook data. 2. Integration and Workflow: Chart-Tank integrates directly into the Microsoft Office ribbon, making it accessible within PowerPoint and Excel. This integration ensures a seamless workflow for creating and editing visualizations. 3. Customization Options: Chart-Tank offers extensive customization options to create tailored, visually appealing charts that effectively convey data. Users can adjust margins to control the spacing between chart elements and edges, enhancing clarity and presentation. Axis breaks are available for focusing on significant data ranges or accommodating outliers without distorting overall trends. The platform also supports flexible data scaling, enabling precise adjustments to align charts with specific analytical needs. Customizable color themes allow users to match visualizations with branding guidelines or presentation aesthetics 🧡 A 38-day free trial is available for new users. 💥Annual subscription includes free upgrades during the subscription period.

Who Is the Company Behind Chart-Tank?

Chata

Chata provides an in-the-moment decision intelligence solution to enterprises and their users. Through our AI, enterprises can eliminate reporting and analytical learning curves for users, and get fast, painless implementation and adoption. When every user has direct access to detailed information from their data warehouse there is less demand on the IT & data analyst teams and more data-driven decision-making across the entire organization. Learn more at www.chata.ai.

Average Rating: 3.0/5.0

Total Reviews: 1

Who Is the Company Behind Chata?

Who Uses This Product?

  • Company Size: 100% Small

Chatterlytics

Chatterlytics — AI-powered business analytics tool to visualize your business data, create reports and dashboards without any technical data expertise.

Who Is the Company Behind Chatterlytics?

Cleriq

Who Is the Company Behind Cleriq?

  • Seller: Cleriq
  • Year Founded: 2026
  • HQ Location: N/A
  • LinkedIn® Page: www.linkedin.com
    2 employees on LinkedIn®

COMET

COMET is a structured investigation and root cause analysis platform built for high-risk industries. It supports organisations in identifying, understanding, and addressing the causes of incidents, audit findings, and recurring operational issues, helping teams move from reactive reporting to proactive risk management. Developed by experienced investigators and used across sectors such as energy, construction, utilities, and transport, COMET offers a consistent and repeatable process that fits into day-to-day operations. How COMET supports your team • Guided workflows to help investigators follow a structured, step-by-step approach • Built-in human factors analysis to surface deeper systemic causes • AI-guided assistance through COMET Companion to prompt better decisions, faster • Root Maps that visually connect causal factors for clearer understanding • Integration with existing systems such as Intelex, Enablon, Maximo and others. No duplication of effort • Actionable dashboards designed by domain experts to help monitor progress and identify trends Flexible and scalable • Enterprise-ready licensing with predictable costs • Scales to support teams across functions and geographies • Training options available to upskill internal teams in both the methodology and platform • Implementation is supported by experienced practitioners, with the option to explore COMET through PoC or free trial Why COMET COMET brings clarity and consistency to investigations. It helps frontline users capture accurate information, guides teams in identifying root causes, not just immediate triggers, and gives leaders greater visibility into systemic issues. By embedding a structured method and supporting it with purpose-built technology, COMET strengthens learning, improves accountability, and helps organisations reduce repeat failures over time. If you are ready to explore the COMET platform: Try COMET for free: https://www.cometanalysis.com/try-comet-for-free Check out our on-demand demo: https://www.cometanalysis.com/comet-on-demand-demo Book your discovery call: https://www.cometanalysis.com/demo

Who Is the Company Behind COMET?

Bijou Barry
BB
Researched and written by Bijou Barry
Updated June 24, 2026