Best Data Visualization Tools - Page 27

How Many Data Visualization Tools Products Does G2 Track?

Total Products under this Category: 478

Category Stats (Aug 2026)

  • Average Rating: 4.43/5 The average rating of products in this category, based on all submitted ratings
  • Top Trending Product: Supersimple (+0.89%) - Among all products in this category, Supersimple recorded the largest rating increase compared to last month

Last updated: August 04, 2026

How Does G2 Rank Data Visualization Tools Products?

Why You Can Trust G2's Software Rankings:

  • 30 Analysts and Data Experts
  • 26,100+ Authentic Reviews
  • 478+ Products
  • Unbiased Rankings

G2's software rankings are built on verified user reviews, rigorous moderation, and a consistent research methodology maintained by a team of analysts and data experts. Each product is measured using the same transparent criteria, with no paid placement or vendor influence. While reviews reflect real user experiences, which can be subjective, they offer valuable insight into how software performs in the hands of professionals. Together, these inputs power the G2 Score, a standardized way to compare tools within every category.

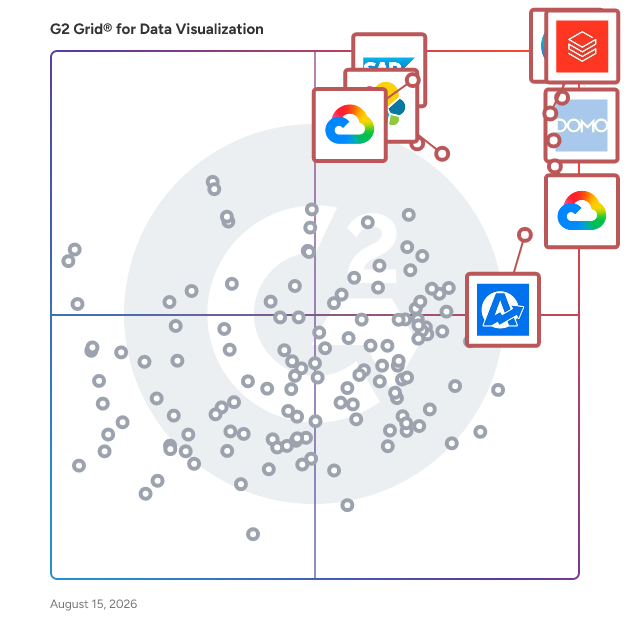
G2 Grid® for Data Visualization Tools

G2 Grid® for Data Visualization Tools plotting products by satisfaction and market presence

Highlighted products: Canva, Databricks, Domo, Looker, Data Studio, Elastic Stack, SAP HANA Cloud, and AgencyAnalytics.

Underlying data: [Grid® JSON](https://www.g2.com/categories/data-visualization-tools/grids.json?focus%5B%5D=canva&focus%5B%5D=databricks&focus%5B%5D=domo&focus%5B%5D=looker&focus%5B%5D=data-studio&focus%5B%5D=elastic-stack&focus%5B%5D=sap-hana-cloud-2025-10-01&focus%5B%5D=agencyanalytics)

Sponsored

Meltwater

Meltwater empowers companies with a suite of solutions that spans media, social, and consumer intelligence. Since 2001, we’ve helped organizations harness the world’s data in real time to fuel smarter decisions, stronger performance and sustainable growth. By analyzing nearly 1 billion pieces of content each day and transforming them into vital insights, Meltwater unlocks the competitive edge needed to drive results. With 27,000 customers, 50 offices across six continents and 2,200 employees, Meltwater is the industry partner of choice for global brands making an impact. We activate the power of data so businesses can make smarter, faster decisions. With the most robust dataset across media, social, consumer trends – and now insights into how large language models (LLMs) shape brand visibility – we give companies a complete view of the conversations, behaviors, and signals influencing their markets. Our powerful AI turns this breadth of data into actionable insights, empowering teams across PR, communications and marketing to confidently drive strategy. -- Mira Studio (AI-Powered Media, Market, and Brand Intelligence Assistant) Key features - Natural language querying - Automated insights - Structured reports - Trend-spotting and explanations with suggested actions - Integrated throughout the full Meltwater Platform - Integrates with Copilot and Slack What is Mira Studio? Mira Studio is Meltwater’s conversational AI teammate for media, market, and brand intelligence. Mira Studio helps PR, comms, and marketing teams cut through complexity and reduce time spent on manual analysis, with prompt-driven reporting, briefing, simplified data exploration, and real-time answers. Who uses Mira Studio? Teams that need quick and shareable insights while reducing manual time spent digging through data. Mira Studio converts Meltwater data into summaries, visuals, and provides explanations through natural language interaction. Get to the why of what’s happening, not just the what. -- Media Intelligence for PR (Media Monitoring and Analysis Platform) Key capabilities - Monitor 6M different media sources - Unlimited search - Real-time alerts - Journalist identification - Competitive benchmarking - Unified, shareable reporting - Predictive analytics for mention forecasting - Brand-level sentiment What is Meltwater Media Intelligence? Meltwater’s media intelligence platform monitors and analyzes earned media coverage through tracking brand mentions and narratives across news, print, broadcast, podcasts, and social media. This enables faster response times to trends or feedback through real-time awareness of message penetration, emerging risks, and consumer sentiment. Who Uses Meltwater Media Intelligence? PR and comms teams use Meltwater Media Intelligence to strengthen PR strategies with accurate measurement of brand impact across media sources. With journalist outreach capabilities within a single platform, PR efforts are streamlined for better results. -- Social Listening and Analytics Key capabilities - Monitoring 200B+ social conversations - Analysis of 300M+ social profiles - Influencer identification - Shareable reporting across earned, owned, and paid social - Brand-level sentiment and predictive analytics for brand measurement and forecasting - AI agents for Boolean search creation and management - AI-powered insights summarize brand and topic narratives - Access to Meltwater API What is Meltwater Social Listening and Analytics? Meltwater social listening and analytics is an integrated platform providing monitoring and AI-powered analysis for billions of social conversations. Connect consumer insights to social strategy and marketing campaigns for a seamless approach to brand promotion, quicker crisis response, and powerful competitor insights without data caps. Who uses Meltwater Social Listening? Marketing and social teams in charge of consumer, competitor, and industry insights. -- Influencer Management (Klear – Influencer Relationship Management Platform) Key capabilities - Database of 30M+ global creator profiles - AI-driven influencer discovery and recommendations - Influencer vetting and brand safety analysis - AI-driven outreach and relationship management - Campaign management and creator collaboration tools - Performance benchmarking and ROI tracking - Competitive influencer intelligence What is our influencer management solution? Klear is Meltwater’s influencer discovery and influencer relationship management solution. Vet, manage, and measure influencers and campaigns at scale from within a single tool. AI-powered influencer recommendations improves targeting accuracy, providing better matches and influencing better ROI. Who uses our influencer management solution? Marketing, PR, and Influencer teams use Klear for implementing and scaling their influencer campaigns. Outreach, gifting, payment, analysis and reporting can all be managed through our platform. -- Enterprise and Professional Services Key capabilities - Analyst-led insights and reporting - Custom data configurations - Enterprise-grade support and delivery What is Meltwater Enterprise and Professional Services? Customized intelligence solutions and professional services from Meltwater experts supports large enterprises with advanced or bespoke requirements. This service provides complex data analysis and reporting that go beyond standard product workflows, and ensures fast and accurate delivery for high-stakes or large-scale intelligence needs.

Visit website

DashMetrics

Create & share easily digestible infographic dashboards.

Who Is the Company Behind DashMetrics?

  • Seller: DashMetrics
  • Year Founded: 2016
  • HQ Location: N/A
  • Twitter: @dashmetricsio
    116 Twitter followers
  • LinkedIn® Page: www.linkedin.com
    2 employees on LinkedIn®

DataCopia

DataCopia offers data visualization solutions to create charts and graphs online.

Who Is the Company Behind DataCopia?

Datafi

Datafi unlocks enterprise data with AI — changing how everyone can find and use the business information they need, regardless of where or how it is stored across the enterprise data ecosystem. Our AI-powered platform connects data from all sources, while our AI-powered Agent transforms plain language questions into requests that find the information needed, while enforcing granular security and data quality controls. We empower everyone, from entry-level to executive-level, with their own personalized AI Agent. Our AI Agent is context aware, intent aware, and user aware, becoming smarter with each use while eliminating unwanted hallucinations. Join Datafi customers, partners and solution providers already powering their business with AI. Learn more at datafi.co

Average Rating: 4.9/5.0

Total Reviews: 4

How Do G2 Users Rate Datafi?

  • Has the product been a good partner in doing business?: 9.6/10 (Category avg: 9.0/10)

Who Is the Company Behind Datafi?

  • Seller: Datafi
  • Year Founded: 2020
  • HQ Location: Seattle, US
  • Twitter: @DatafiLabs
    29 Twitter followers
  • LinkedIn® Page: www.linkedin.com
    22 employees on LinkedIn®

Who Uses This Product?

  • Company Size: 50% Large, 25% Medium

What Are Recent G2 Reviews of Datafi?

DataviCloud

DataviCloud is an all-in-one data platform for startups & SMEs. It helps you curate, analyze & visualize all your business data & KPIs in one place. So you can focus on making better decisions without toggling spreadsheets.

Who Is the Company Behind DataviCloud?

DataViRe

DataViRe is a powerful reporting automation tool built specifically for Grafana and Kibana. It converts dashboards into visually structured, professional grade reports and automatically delivers them to stakeholders on a scheduled basis via email, Slack, WhatsApp, Microsoft Teams, and more. Designed with operational teams in mind such as SIEM, SecOps, CyOps, DevOps, and ITOps DataViRe helps streamline reporting workflows so teams can stay focused on their core responsibilities. By automating the reporting process, DataViRe saves valuable time, reduces manual effort, and ensures consistent, reliable communication of critical insights.

Who Is the Company Behind DataViRe?

  • Seller: DataViRe
  • Year Founded: 2023
  • HQ Location: Madurai, IN
  • LinkedIn® Page: www.linkedin.com
    1 employees on LinkedIn®

Daydream

Daydream offers business intelligence tools crafted for executives managing critical operations.

Who Is the Company Behind Daydream?

DIGDASH ENTERPRISE

DigDash is a European software editor of a dynamic dashboard solution and an expert in Business Intelligence. DigDash is a new-generation platform that enables its more than 500 customers and 150,000 users to explore and visualize their data in a simple, non-technical way, enabling them to make more informed business decisions.

Who Is the Company Behind DIGDASH ENTERPRISE?

  • Seller: DIGDASH
  • Year Founded: 2006
  • HQ Location: La Barque, FR
  • LinkedIn® Page: www.linkedin.com
    57 employees on LinkedIn®

Dyntell BI

Dyntell Bi is a robust visualization, analytics and prediction tool that was born from our ERP solution. Dyntell Bi takes your raw data and makes it come alive. With crystal clear visuals, you can tell the important stories that were buried in the data glut. You can share dashboards and finalized charts in one click. And you can finally turn your information into pure inspiration.

Who Is the Company Behind Dyntell BI?

EasyBI BSC

Many companies lack a centralized and up-to-date overview of their critical KPIs. A common reason for this deficit is the perception, that the necessary infrastructure and IT-setup is too expensive. Our easyBI Dashboards offer an affordable and secure introduction to modern Business Intelligence

Who Is the Company Behind EasyBI BSC?

easyBI Tiles

Our easyBI Dashboards provide you with a fast, affordable and secure introduction to modern Business Intelligence. Start small and grow with your needs.

Who Is the Company Behind easyBI Tiles?

Elusidate

Elusidate is a presentation tool that simplifies data analysis and presentation, making complex data easy to understand.

Who Is the Company Behind Elusidate?

Embedful

Embedful turns analytics into a feature your customers can see and interact with. Build charts, tables, counters, and dashboards in minutes using Google Analytics, Google Sheets, Excel, CSV files or APIs, and share them instantly. Visualizations are interactive by default, and branding can be tailored with your logo and theme colors. They can then be embedded or shared anywhere, making analytics simple and engaging for every user.

Who Is the Company Behind Embedful?

Exply

Explore Exply BI Features

Who Is the Company Behind Exply?

Flexa Tables

Flexa Tables is a Microsoft-certified Power BI custom visual built for BI developers and Finance teams who are tired of writing DAX variance measures. The problem it solves: In native Power BI, every variance report requires a separate DAX measure per metric per period. A Finance report tracking Revenue, Margin, Units, Cost, and EBITDA across DoD, MoM, and YoY generates 30+ measures — all of which break when the schema changes. Most BI developers spend more time maintaining variance measures than building actual reports. Flexa Tables eliminates this entirely. DoD, MoM, and YoY variance are built-in buttons. Select a period, click once, and the variance column appears — absolute value and percentage, color-coded green/red — directly in the published report. No DAX. No Desktop. No republishing. Who uses it: - BI Developers who want to stop rebuilding variance logic every sprint - Finance Analysts and FP&A teams who want self-service variance without filing a ticket - Data Managers who need to ship financial reports faster Core capabilities: - Built-in DoD / MoM / YoY — no measures required - Runs in Power BI Service — end-users add variance without Desktop access - Works with any existing data model — no changes to Power Query, DAX, or data sources - Absolute + percentage variance in a single column - Automatic green/red conditional formatting - Microsoft AppSource certified — installs in under 5 minutes - Free trial, no credit card required Trusted by teams at Accenture, Intel, BP, and General Motors. Available on Microsoft AppSource.

Who Is the Company Behind Flexa Tables?

flex.bi

flex.bi is a business intelligence and reporting system, it's a flexible and easy way to analyze and visualize your company's progress. A business intelligence tool that helps to gather all your company data in one place, save time on manual data management, make decisions faster, and motivate your team to reach targets in a more effective way. Best For: Small & medium businesses in any field who have data in different places (ERP systems, Excel or other files) & need a tool to unify all data in one place, visualize it & prepare for analysis. flex.bi Pricing Overview: flex.bi pricing starts at 35 EUR/ month. flex.bi offers a free trial. See additional pricing details below https://flex.bi/pricing/

Who Is the Company Behind flex.bi?

  • Seller: flex.bi
  • Year Founded: 2016
  • HQ Location: Riga, LV
  • LinkedIn® Page: www.linkedin.com
    7 employees on LinkedIn®
Bijou Barry
BB
Researched and written by Bijou Barry
Updated June 24, 2026