Top Free Analytics Platforms - Page 10

How Many Analytics Platforms Products Does G2 Track?

Total Products under this Category: 604

Category Stats (Sep 2026)

  • Average Rating: 4.51/5 The average rating of products in this category, based on all submitted ratings
  • Top Trending Product: Cube (+2.46%) - Among all products in this category, Cube recorded the largest rating increase compared to last month

Last updated: September 26, 2026

How Does G2 Rank Analytics Platforms Products?

Why You Can Trust G2's Software Rankings:

  • 30 Analysts and Data Experts
  • 29,600+ Authentic Reviews
  • 604+ Products
  • Unbiased Rankings

G2's software rankings are built on verified user reviews, rigorous moderation, and a consistent research methodology maintained by a team of analysts and data experts. Each product is measured using the same transparent criteria, with no paid placement or vendor influence. While reviews reflect real user experiences, which can be subjective, they offer valuable insight into how software performs in the hands of professionals. Together, these inputs power the G2 Score, a standardized way to compare tools within every category.

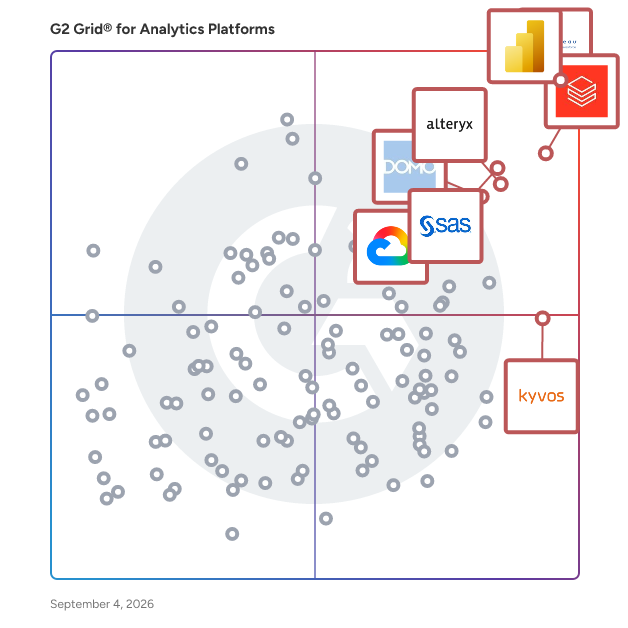
G2 Grid® for Analytics Platforms

G2 Grid® for Analytics Platforms plotting products by satisfaction and market presence

Highlighted products: Microsoft Power BI, Tableau, Databricks, SAS Viya, Alteryx, Domo, Looker, and Kyvos Semantic Layer.

Underlying data: [Grid® JSON](https://www.g2.com/categories/analytics-platforms/grids.json?focus%5B%5D=microsoft-microsoft-power-bi&focus%5B%5D=tableau&focus%5B%5D=databricks&focus%5B%5D=sas-sas-viya&focus%5B%5D=alteryx&focus%5B%5D=domo&focus%5B%5D=looker&focus%5B%5D=kyvos-semantic-layer)

Green, the AI Analyst

Green is an AI Analyst that answers business questions in natural language, connects data across sources, and explains how it arrived at an insight. It understands context, reasons through information, and helps teams move from data to decisions without digging through dashboards or waiting on manual analysis.

Who Is the Company Behind Green, the AI Analyst?

Intelligence Navigator

Intelligence Navigator is an analytics software that helps companies turn data into strategic decisions. The platform brings together advanced analytics, customer intelligence, sentiment analysis, dynamic pricing optimization, forecasting, competitive intelligence, KPI analytics, OKR management, workflow automation, AI agents, dashboard creation, automated reporting, and AI-powered presentations in one integrated environment. Users can build interactive dashboards, generate executive-ready reports and presentations, monitor business performance, analyze customer behavior, forecast key metrics, optimize pricing, track strategic objectives, and automate recurring analytical workflows. Intelligence Navigator also supports advanced financial reporting by transforming accounting data such as trial balances and general ledgers into structured financial statements, including balance sheets, income statements, and cash flow statements. The platform can help map accounts, identify items requiring review, and streamline the process of turning raw financial data into clear, decision-ready reporting. From operations, e-commerce, marketing, and customer experience to finance and corporate strategy, Intelligence Navigator is designed to make enterprise-grade analytics, reporting, and decision intelligence practical and accessible to both technical and non-technical teams.

Who Is the Company Behind Intelligence Navigator?

  • Seller: Xpherium
  • Year Founded: 2025
  • HQ Location: San Diego, US
  • LinkedIn® Page: www.linkedin.com
    1 employees on LinkedIn®

intellsys AdGPT

Intellsys AdGPT is an AI-driven prescriptive advertising intelligence platform that helps businesses optimize their performance marketing decisions. The platform connects with over 200 ad data sources, including Google Ads, Meta, Amazon, Shopify, CRM, and analytics tools, delivering a unified, real-time view of campaign to conversion metrics. Through a conversational AI interface, marketers ask questions and receive precise metrics plus prioritized next moves tied to CAC, ROAS, and LTV. What is the Role of Intellsys AdGPT? Intellsys AdGPT acts as your on-demand strategic advisor, intelligently diagnosing performance issues like budget leaks or creative fatigue and prescribing ranked, actionable steps with clear reasons and projected outcomes. It replaces dashboard drift and guesswork with confident, data-driven decisions and compounding results, accelerating marketing velocity without demanding complex setups or siloed analysis. Why Intellsys AdGPT? Marketing complexity is rising with multi-channel spend, privacy shifts, and fragmented analytics. Intellsys AdGPT solves this by unifying all marketing data into one authoritative source updated hourly, providing clarity and alignment across teams. It empowers marketers to make faster, smarter decisions with transparent, secure AI-driven recommendations, helping teams move beyond traditional reporting and scale growth effectively. Intellsys AdGPT Growth Marketing Tool Key Features: 1. Unified Data Integration Connects 200+ advertising, social media, CRM, and analytics platforms for seamless, consistent real-time reporting. 2. Conversational Ask-and-Act Interface Plain-English questions get you instant metrics plus prioritized next moves—in one conversation, one truth. 3. Prescriptive Playbooks Every insight ends with a step-by-step, outcome-ranked plan showing what to do now and why it matters. 4. Leak Opportunity Radar Automatically surfaces campaign and creative fatigue zones or performance leaks before they impact ROI. 5. Enterprise-Grade Security & Governance Role-based access, audit trails, GDPR-compliance, and certifications ensure secure and trustworthy use. Key Benefits of Using Intellsys AdGPT: 1. Accelerate decision cycles from days to minutes, boosting experiment velocity and agility 2. Gain clear, trusted insights to optimize budget allocation and reduce wasted spend 3. Achieve alignment across marketing, growth, and finance teams with one version of truth 4. Reduce manual data wrangling with automated diagnostics and prescriptive next steps 5. Drive measurable growth with projected impact tied to all recommendations

Average Rating: 4.5/5.0

Total Reviews: 2

Who Is the Company Behind intellsys AdGPT?

Who Uses This Product?

  • Company Size: 100% Medium

What Do G2 Reviewers Say About intellsys AdGPT?

AI-generated summary from verified user reviews

Pros
  • Users find the dashboards for data analysis by Intellsys AdGPT extremely useful and efficient for assessing data.
  • Users find the data dashboards created by intellsys invaluable for efficient data analysis and assessment.
  • Users find the analytics dashboards from Intellsys AdGPT exceptionally useful for comprehensive data analysis.
  • Users find that AdGPT significantly enhances data assessment efficiency, making it a valuable tool for performance evaluation.
  • Users find that intellsys AdGPT offers significant time-saving benefits by streamlining data assessment processes.
Cons
  • Users note that the slow loading during dashboard creation hinders their ability to excel and customize effectively.
  • Users suggest that improving response time is essential for a better experience with AdGPT's dashboard creation.
  • Users note that update issues delay data processing, taking 3-4 hours, which hampers real-time utility.

What Are Recent G2 Reviews of intellsys AdGPT?

Kalibri AI Analytics

AI-powered Business Intelligence platform that gives mid-size businesses two powerful tools that work together: an AI Implementation Audit that identifies exactly where artificial intelligence can transform your operations, and a paid Business Performance Analytics module that turns your existing data into enterprise-grade insights without a data team or expensive BI software. MODULES: Business Performance Analytics: Business Performance Analytics platform is an enterprise-grade business intelligence without the enterprise price tag or the need for a dedicated data team. Upload your business data, ask questions in conversational English, and receive AI-powered insights, charts, and a polished report ready to share with stakeholders. The Cross-Analysis feature allows you to compare 2 or more documents against each other. (example: your actual performance data against your strategies or financial targets.) AI Implementation Audit: The AI Implementation Audit is a structured discovery tool designed to identify where artificial intelligence can meaningfully improve your business operations. You answer a set of questions about how your business works, and our AI delivers a prioritized report showing exactly where automation, AI assistants, or workflow intelligence would deliver the greatest return.

Who Is the Company Behind Kalibri AI Analytics?

Kontrollytics AI

Kontrollytics is an AI-powered business reporting SaaS that automatically generates professional PDF reports from Shopify, Stripe and Google Analytics 4 data. Instead of spending hours exporting data, building charts in Excel and writing analysis manually, businesses and agencies connect their data sources once and receive a complete, professional business report in under 3 minutes. The AI — powered by Anthropic's Claude — analyzes real numbers, identifies trends and anomalies, and writes a complete report including cover page, KPI cards, delta tables, charts and a concrete action plan with deadlines. No templates, no formatting, no manual work. Kontrollytics is built for SMEs and digital agencies across the DACH region. Agencies can operate the platform under their own branding via the White-Label plan — custom logo, custom domain, custom sender email — and offer automated reporting as their own product to clients. Scheduled Reports run fully automatically and are delivered by email monthly or weekly without any manual intervention. The platform is GDPR-compliant, hosted on Google Cloud Run in the EU Frankfurt region, and available from €19 per month. A free demo is available without signup at kontrollytics-ai.com.

Who Is the Company Behind Kontrollytics AI?

Kyligence Zen

Welcome to the next generation of business intelligence where your business metrics aren’t just numbers but a powerhouse of intelligent insights at your fingertips. Dive into Kyligence Zen, your centralized metrics hub that transforms data into actionable intelligence. Rooted in the single source of truth of metrics, Kyligence Zen provides everyone with accurate, comprehensive, and intelligent decision support tailored for modern enterprises.

Average Rating: 4.0/5.0

Total Reviews: 1

How Do G2 Users Rate Kyligence Zen?

  • Has the product been a good partner in doing business?: 6.7/10 (Category avg: 9.2/10)
  • Steps to Answer: 8.3/10 (Category avg: 8.4/10)
  • Reports Interface: 8.3/10 (Category avg: 8.8/10)
  • Calculated Fields: 8.3/10 (Category avg: 8.5/10)

Who Is the Company Behind Kyligence Zen?

  • Seller: Kyligence
  • Year Founded: 2016
  • HQ Location: San Jose, US
  • Twitter: @kyligence
    1,196 Twitter followers
  • LinkedIn® Page: www.linkedin.com
    116 employees on LinkedIn®

Who Uses This Product?

  • Company Size: 100% Large

What Are Recent G2 Reviews of Kyligence Zen?

MagneFo

MagneFo is designed to be an intelligence platform CEOs and other C-suite leaders to aid their clarity and control over their organization’s overall performance. It’s primary reason to exist is to eliminate delays and redundant blind spots that occur as a result of traditional reporting tools and practices. Instead, MagneFo offers real-time visibility into your company’s ROI – down to the minutest details. From top-line revenue and operational expenses to profitability trends and resource allocations, broken down based on individual projects, campaigns, and departments, MagneFo’s analytics provides an instant overview of the financial health of an organization with remarkable accuracy.

Who Is the Company Behind MagneFo?

  • Seller: MagneFo
  • Year Founded: 2025
  • HQ Location: Dover, US
  • LinkedIn® Page: www.linkedin.com
    1 employees on LinkedIn®

Omnicontext

Omnicontext™ Complete Analytic Platform for Digital Productivity and Technology Operations. Omnicontext™ is designed to collect, integrate, and analyse a wide range of distributed data sources to create a comprehensive view and detailed understanding of events, activities, and structures in organizations of any size. Data collection, consolidation and reporting to the users is fully automated. It can also operate as middleware, processing data for use by other applications. The OmniContext™ software produces numerous key indicators for productivity and operational performance.

Who Is the Company Behind Omnicontext?

Pliable

Pliable is a fully managed data platform that integrates all your systems, cleans and deduplicates your data, models it into a single source of truth, and delivers ready-to-use dashboards — plus an embedded data analyst you can talk to. We handle the hard parts for you. No pipelines to build, no SQL to write, no data engineering team required. Pliable connects your tools, fixes the messy data, aligns your metrics, and gives every team clear, accurate insights fast. Companies use Pliable to save time, reduce headcount costs, and make better decisions because their data is finally clean, consistent, and easy to understand. Instead of buying a BI tool and doing all the work yourself, Pliable gives you the platform and the team to turn your data into revenue.

Average Rating: 5.0/5.0

Total Reviews: 1

Who Is the Company Behind Pliable?

  • Seller: Pliable
  • Year Founded: 2023
  • HQ Location: San Francisco, US
  • LinkedIn® Page: www.linkedin.com
    14 employees on LinkedIn®

Who Uses This Product?

  • Company Size: 100% Small

What Do G2 Reviewers Say About Pliable?

AI-generated summary from verified user reviews

Pros
  • Users value the ease of use of Pliable, simplifying their data mapping tasks significantly.
  • Users find the simple UI of Pliable significantly enhances their efficiency in mapping values in SQL.
  • Users find the simple UI of Pliable enhances their efficiency in mapping values in SQL.

What Are Recent G2 Reviews of Pliable?

Point Sigma

Point Sigma is an AI-powered end-to-end automated data analytics platform that connects, cleans, transforms, and analyzes your data, automatically surfacing graphs to explore. Point Sigma helps businesses cut costs by up to 50%, make smarter decisions and gain competitive advantage by shrinking analysis time by up to 95%.

Who Is the Company Behind Point Sigma?

Q Research Software by Displayr

Q by Displayr is data analysis and reporting software. It's designed to make survey analysis & reporting faster and easier. It performs all aspects of the analysis and reporting, from data cleaning and coding through to creating tables and advanced analyses. It's also tightly integrated with Displayr and PowerPowerpoint for seamless reporting.

Average Rating: 4.7/5.0

Total Reviews: 33

How Do G2 Users Rate Q Research Software by Displayr?

  • Has the product been a good partner in doing business?: 9.9/10 (Category avg: 9.2/10)
  • Steps to Answer: 8.6/10 (Category avg: 8.4/10)
  • Reports Interface: 8.4/10 (Category avg: 8.8/10)
  • Calculated Fields: 8.7/10 (Category avg: 8.5/10)

Who Is the Company Behind Q Research Software by Displayr?

  • Seller: Displayr
  • HQ Location: Pyrmont, New South Wales
  • Twitter: @Displayrr
    499 Twitter followers
  • LinkedIn® Page: www.linkedin.com
    92 employees on LinkedIn®

Who Uses This Product?

  • Top Industries: Market Research
  • Company Size: 67% Small, 24% Medium

What Are Recent G2 Reviews of Q Research Software by Displayr?

What Are G2 Users Discussing About Q Research Software by Displayr?

Recoonlytics

Recoonlytics is an AI-powered data analytics platform designed to simplify spreadsheet and CSV analysis for students, analysts, researchers, startups, and business teams. Users can upload Excel, CSV, or tabular datasets to automatically detect missing values, duplicates, column types, trends, and data quality issues. The platform generates interactive dashboards, visual analytics, summaries, and insights without requiring advanced technical knowledge. Recoonlytics focuses on reducing manual spreadsheet work by combining automated data cleaning, AI-assisted analysis, dashboard generation, and business intelligence workflows into a single experience. Key capabilities include: • AI-generated dashboards • Automatic data cleaning and preprocessing • Missing value and duplicate detection • Spreadsheet analytics • CSV and Excel analysis • Data quality scoring • Interactive visual reports • Fast large-file processing • Business and research analytics Recoonlytics is designed for users who want a faster alternative to manual spreadsheet analysis tools and complex BI platforms.

Who Is the Company Behind Recoonlytics?

Senpai by silverspark.ai

What is Senpai by Silverspark.ai? Senpai, the most secure AI data analyst, empowers every stakeholder to chat with, summarize, and visualize internal data instantly, without analyst tickets or complex dashboards. It runs entirely on-premises or in your private cloud so no data leaves your environment and no AI models are trained on your private raw data, helping you meet data sovereignty and compliance needs. What it helps you do? Cut data turnaround from days to seconds: ask plain-English questions and get trusted charts, tables, and narrative explanations. Scale self-serve insights: enable non-technical teams to answer ad hoc questions without relying on analysts. Make decisions in market context: compare internal KPIs with client-approved external signals (category trends, pricing, demand indicators, competitor activity, seasonality) to guide entry, pricing, positioning, and channel mix, all processed inside your environment. Key capabilities? Conversational analytics: natural-language Q&A that returns metrics, visualizations, and written insights. Privacy-first deployment: on-prem or private cloud; no external data sharing; no model training on your private raw data. Integrations and automation: connect to your existing tools and pipelines; route outputs into workflows (for example, marketing actions and reporting). White-label ready: tailor branding and industry-specific use cases. Admin controls: role-based access and governance aligned to your security model. Common use cases? Get your data in seconds by chatting to your data, Pricing and discount analysis; regional and channel performance; executive Q&A; “why” diagnostics behind spikes, dips, and churn; PR to PO to payment visibility; always-on market comparisons for GTM. Why teams pick Senpai? Data stays inside your perimeter with on-prem or private-cloud deployment. Blended intelligence pairs internal performance with approved market data for confident actions. Time and cost savings by reducing one-off analysis work and boosting adoption beyond data teams. Try senpai first-hand at https://chat.silverspark.ai/ PS - The chat window optimisation for phones is still under progress please use the chat window either on desktop view or on bigger screen, apologies for the inconvenience.

Who Is the Company Behind Senpai by silverspark.ai?

Spotfire Enterprise

Spotfire® is a visual data science platform designed to help organizations address complex, industry-specific challenges by effectively utilizing data. This solution offers a range of flexible packaging options tailored to meet the diverse needs of teams at various stages of their visual data science journey. Spotfire® Enterprise is designed to scale visual data science securely and efficiently across the entire organization. It delivers the governance, performance, and flexibility needed to make analytics mission-ready, ensuring teams can collaborate on insights while maintaining the highest levels of security and compliance. With centralized administration, role-based access, and full-stack integration, Spotfire Enterprise enables organizations to roll out analytics at scale without compromising on governance or control. Built for large deployments, Spotfire Enterprise combines collaboration with enterprise-grade safeguards. Users can publish and share analyses seamlessly across departments. At the same time, IT teams benefit from robust security features, including identity and access management integration, role-based permissions, audit logs, and data lineage support. This ensures compliance with both internal policies and external regulations, while providing stakeholders with confidence in the reliability of their data-driven decisions. The platform’s scalability supports thousands of users, backed by centralized license and user management that simplifies administration across complex environments. Flexible integration with third-party systems and APIs extends its capabilities, enabling organizations to customize workflows and embed Spotfire into existing ecosystems. Automation features, including scheduled and event-triggered report distribution, ensure decision-makers always have access to the latest insights without manual intervention. By uniting powerful analytics with enterprise-grade infrastructure, Spotfire Enterprise empowers organizations to foster collaboration, extend insights across teams, and operationalize analytics at scale, all while ensuring governance, security, and efficiency remain uncompromised. Collaborate securely, govern confidently, and scale analytics across your organization. Spotfire Enterprise provides the trusted foundation for delivering analytics at scale, combining centralized administration, security, and automation with the flexibility of the Spotfire platform. Deploy on-premises or in the cloud, manage users and permissions easily, and ensure compliance through audit logs, lineage, and identity integration. Enable every team to access consistent, up-to-date insights with scheduled updates, automation services, and Python/R services. IT teams maintain full control; business users enjoy fast, governed access to trusted analytics. Best for: Organizations rolling out Spotfire enterprise-wide with strict security, compliance, and performance requirements.

Who Is the Company Behind Spotfire Enterprise?

Veezoo

Veezoo is an Agentic Analytics platform engineered for trust and reliability, purpose-built to empower every business user — regardless of technical background — to ask questions about their data and receive accurate, governed, and auditable answers. Founded in 2016 as a spin-off from ETH Zurich, Veezoo has been building AI-native analytics long before large language models became mainstream, combining Agentic AI with a proprietary Knowledge Graph architecture. At the core of Veezoo is the Knowledge Graph: a semantic layer that captures a company's business ontology, KPI definitions, metrics, governance rules, and authorization logic. Unlike conventional AI analytics tools that allow language models to write SQL directly — leading to hallucinated metrics and inconsistent results — Veezoo's AI translates every natural language question into Veezoo Query Language (VQL), which is then compiled to SQL through a deterministic, rule-based process. This means the AI never touches raw database tables, business logic is always applied consistently, and every result is fully traceable and auditable. Business users interact with Veezoo through a conversational chat interface, asking questions in plain language and receiving instant, verified answers with charts, tables, and dashboards. Veezoo interprets the data, suggests next steps, and summarizes key insights. Monitoring agents can investigate anomalies and alert teams when something requires action. Every chart title, filter, and label is rendered directly from VQL — not generated by an AI — so users can verify exactly what the data shows and hover over any term to see its governed definition. For data teams, Veezoo provides a Knowledge Graph IDE for modeling semantic layers from scratch using AI, leveraging existing documentation. The platform supports version control, BI-as-Code workflows, development branches, and automated tests — following best practices of modern analytics engineering. The Knowledge Graph lives in Git, making it versioned, reviewable, and auditable without vendor lock-in. Veezoo integrates natively with 17+ databases and data warehouses including Snowflake, Google BigQuery, Databricks, Amazon Redshift, PostgreSQL, MySQL, Microsoft SQL Server, Oracle, SAP HANA, and more. It also integrates with dbt Cloud to import models, metrics, and documentation, and delivers scheduled results and alerts directly to Slack and Microsoft Teams. An MCP server allows other AI tools such as Claude, ChatGPT, and Gemini to query the governed Knowledge Graph, and a public REST API enables custom integrations, embedded analytics, and CI/CD automation. Veezoo supports embedded analytics, allowing organizations to integrate the conversational analytics experience directly into their own applications in multi-tenant environments. The platform also features customizable branding, collaborative dashboards, and export capabilities to PDF, PNG, JPEG, SVG, and Excel. Recognized as a 2024 Gartner Cool Vendor in AI Models and Natural Language Technologies, Veezoo is trusted by thousands of users at companies including AXA, Bayer, Baloise, Breitling, Valora, and Air Up. The platform is headquartered in Zurich, Switzerland, and serves organizations ranging from innovative startups to Fortune 500 enterprises across industries including insurance, retail, consumer goods, and financial services.

Average Rating: 5.0/5.0

Total Reviews: 1

How Do G2 Users Rate Veezoo?

  • Has the product been a good partner in doing business?: 10.0/10 (Category avg: 9.2/10)

Who Is the Company Behind Veezoo?

  • Seller: Veezoo
  • Company Website:
  • Year Founded: 2016
  • HQ Location: Zurich, CH
  • LinkedIn® Page: www.linkedin.com
    19 employees on LinkedIn®
Who Uses This Product?

  • Company Size: 100% Small

What Are Recent G2 Reviews of Veezoo?

Tian Lin
TL
Researched and written by Tian Lin
Updated July 2, 2025