AI-Generated Results
Finding matches…
Tissue – Table of Linked Issues is a Jira app designed to enhance project management by providing clear, tabular reports of related issues across different projects and issue types. It enables users to visualize complex issue hierarchies, such as Tasks linked to Sub-Tasks or Initiatives connected to Epics and Stories, facilitating better tracking and management of project relationships.
Key Features and Functionality:
- Linked Issues Table Gadget: Displays up to four levels of linked issues in a table format, allowing comprehensive visualization of issue hierarchies.
- Tissue Reports in Projects: Provides out-of-the-box reports within Jira projects, showcasing relationships between issues without additional configuration.
- Configurable Display Options:
- Text Mode: Offers a choice between text and non-text modes, with non-text mode rendering elements like issue keys and users as links, and statuses and issue types as graphics.
- Smart Grouping: Merges cells across rows with identical values for a cleaner, more organized display.
Primary Value and User Benefits:
Tissue addresses the challenge of managing and visualizing complex issue relationships within Jira. By presenting linked issues in a clear, tabular format, it enhances project oversight, improves tracking of issue dependencies, and streamlines reporting processes. This leads to more efficient project management and better-informed decision-making for teams handling intricate project structures.
Not seeing what you're looking for?
Dive deeper into "Tabula" on G2 AI
The 360 feedback system automatically tabulates the results and presents them in a format that helps the feedback recipient create a development plan

Tabbles is a file tagging application that allows users to organize and find their files on their hard drive or on shared folders.

This solution identifies and anonymizes Personally Identifiable Information like Name, SSN, Email, Phone numbers from tabular data. The Solution is designed to work on structured data source.
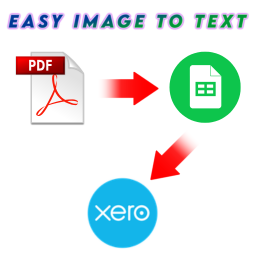
Convert PDF to Google Sheets and CSV in 1 click. Extract any tabular data from PDF or Image, with a Table OCR that lives inside Google Sheets as a sidebar.

Quidnunc offers hundreds of millions of records from non-profit filings in tabular form. Search, filter, and download details of financial information, grants, activities, associated persons and businesses associated with almost 2 million non-profit organizations.

Complex office components for embedding in any java application both on client and on server sides. Full-featured Text Editor, Tabular Processor, Charts (graphics) of different types, working with files of different formats including PDF, DOCX, RTF, PostScript.

Database File Recovery MDB Reader is an all-in-one tool that lets you open and view Microsoft Access Database (MDB) files without needing Microsoft Access installed. It shows the file content in a clear, tabular format, making it easy to read and analyze.

Generate privacy-safe synthetic data across text, tabular, and image data with differential privacy, without exposing original customer records. CUBIG DTS helps regulated teams augment scarce data, correct class imbalance, replace missing values, and improve AI training
Neuralk-AI specializes in developing advanced AI embedding models tailored for structured data representation, enabling enterprises to harness the full potential of their tabular datasets. By leveraging proprietary Graph Neural Network (GNN) architectures and sophisticated training methodologies, Neuralk-AI delivers state-of-the-art embeddings optimized for various business applications.

Tablextract is an AI-powered tool designed to automate the extraction of tables from various document formats, including PDFs, images, and scanned documents. By leveraging advanced artificial intelligence, it accurately identifies and extracts tabular data, preserving complex structures such as merged cells and special characters. This significantly reduces the time and effort associated with manual data entry, allowing users to export the extracted data directly into formats like Excel, CSV, or JSON. With a user-friendly interface, Tablextract streamlines the data extraction process, making it accessible to professionals across various industries.
Key Features:
- Multi-Format Support: Extracts tables from a wide range of document types, including PDFs, images (PNG, JPG), and scanned documents.
- AI-Powered Recognition: Utilizes advanced AI algorithms to accurately detect and extract tables, even from complex or poorly formatted documents.
- Preservation of Table Structure: Maintains the integrity of complex table layouts, including merged cells and special characters, ensuring data accuracy.
- Flexible Export Options: Allows users to export extracted tables in multiple formats, such as Excel, CSV, JSON, or directly to the clipboard for immediate use.
- Selective Extraction: Enables extraction of tables from specific sections or pages of documents, offering customizable output formats.
Primary Value and Problem Solved:
Tablextract addresses the common challenge of manual data entry from unstructured sources, which is often time-consuming and prone to errors. By automating the extraction of tables from various document formats, it enhances efficiency and accuracy for professionals who regularly handle tabular data. This includes financial analysts, researchers, and business intelligence professionals who need to process data from reports, scientific papers, and other documents. By reducing manual effort and minimizing errors, Tablextract allows users to focus on higher-value tasks, thereby improving overall productivity.

Nutrition Facts Label Maker is an online tool for creating FDA-compliant Nutrition Facts labels. Choose from 13 label formats, including standard vertical, tabular, linear, dual-column and aggregate. Enter your nutrient values and preview the label free in your browser, with no sign-up. When it's ready, download a print-ready PDF for $4. It's built for small food businesses, home bakers, cottage-food sellers, caterers and food startups who need accurate labels without expensive software or a lab subscription.

DataBid gives commercial general contractors, subcontractors, suppliers, and manufacturers early access to verified public and private construction opportunities across Ontario, Alberta, and Illinois. The platform tracks every project from pre-planning and design through bidding, addenda, plan holders, and bid results, complete with verified company decision-maker contacts. With advance notice on upcoming work, full digital specs, and historical bid tabulations, construction professionals use DataBid to bid with confidence and win more jobs.

EazyVC is determined to build tech backed secured voting platform that can bring revolutionary changes in how elections happen.
We enable organizations and establishments to experience a seamless election process that is accurate and trustworthy. We take the load off your shoulders by creating a tailored voting platform in the digital environment where people can access their right to vote safely with ease while we ensure flawless nitty-gritty of your elections, their tabulation and statistics with guaranteed privacy and protection.

Seamlessly transition SQL Server Analysis Services (SSAS) tabular and multidimensional models to Microsoft Fabric. Driven by Pulse Convert, this software converts DAX, MDX, relationships, calculated columns, and security roles into native Fabric semantic models with 75–90% automated accuracy. Eliminate manual rebuilding while preserving business logic and analytical performance. Our guarantee: if any competing solution reaches even 30% accuracy against us, we do your migration for free. Modernize your semantic layer risk-free.

NeuralDocs connects financial documents and data sources with reviewable information, contextual analysis, and coordinated work. It can turn supported PDFs and images into structured data, prepare tabular sources for analysis, keep currencies separated, and preserve links back to source evidence. Teams can move from reviewed information into tasks, decisions, meetings, dates, and follow-up while keeping human approval in the loop. Evidelya helps explain selected financial context and prepare next steps. Availability depends on plan, permissions, data, and configured integrations.

Reliant AI is a pioneering provider of generative AI-powered data analytics software, specifically designed to accelerate and enhance research processes within the biopharmaceutical industry. Their flagship product, Reliant Tabular, serves as an AI workbench that enables life science analysts to efficiently find scientific evidence through automated systematic reviews, asset scans, comprehensive analyses, and a customizable data platform. By leveraging advanced machine learning models optimized for biopharma topics, Reliant AI addresses the challenges of information overload and time-consuming data analysis, allowing professionals to focus on critical decision-making and innovation.

The CropOne system collates, visualizes, and analyzes agricultural yield data captured during the agricultural season for patterns, registration anomalies, crop patterns, and procurement predictions. It is designed for both centralized and decentralized crop procurement systems. Satellite imagery that captures granular and accurate data about farm plots will be able to ensure that only genuine farmers get MSP benefits. It works in conjunction with Paddy Procurement Automation System (P-PAS).
CropOne Analytics is a great enabler for transforming the agriculture for the government (state/nation) by capturing data from the farms and farmers. This would strengthen the procurement system while ensuring food security. Data backed decision favors effective policy intervention and better planning.
Components of CropOne
1. Crop Mapping
The Land GIS is the visual window in the stack, offering unmatched visual control with filters using High Resolution Satellite imagery, Valid/Invalid/Doubt Crop and geographical boundaries.
2. Land Monitor
e Land Monitor is a state-of-the-art Management Information System that tabulates and aggregates data from automated procurement system and field surveys conducted via the official through mobile-app.
3. Land Survey
The Land Survey is a mobile attachment and front for Land Monitor and is used for land parcel surveys. The app works by accessing geo-location of both the land & the surveyor. The inbuilt compass feature ensures the survey can be completed only inside or adjacent to the geofence of the land parcel.
4. Analytics Dashboard
Insightful analytics in the form of powerful reports provide direction for better decision making, pertaining to trend analysis, farm policy, tracking anomalies & traceability of crops and so on. The analytics are in easy-to-consume which are easily generated in the app.
Benefits
1. Visual Outputs: With Land GIS’ visual outputs, anomaly and crop pattern tracking is a
breeze.
2. Ease of Survey: Improve efficiency & authenticity of field surveys via LS app.
3. Predictive Analytics: Land Analytics crunches through historical tabular data, field
inputs & HRSI for predictions.
4. Anomaly Tracker: Detect anomalies in yield at the end of a crop season via optical
image analysis.
5. Trend Analysis: Find scientific patterns in land & farmer registration through Land
Analytics.
6. Improve Transparency: Improve farmer registration, set more optimal procurement
targets & procure more from eligible farmers with CropOne Insights.
7. Efficient Traceability: Get an accurate picture of crop traceability and the farmer
producing it by tracking the critical data on crops received by millers
8. Effective monitoring: Empowers the state authorities to have end-to-end visibility on
farms and farmers.
9. Map target beneficiaries: Enlist genuine beneficiaries and enhance outcomes of farm
policy interventions
10. Flexibility: Whether it is centralized or decentralized procurement, with CropOne, you’re
at scale.
11. Crop Agnostic: Applicable and works across varieties of crops.
12. Integration: It can integrate with your crop procurement tech for post-processing
analysis.
13. Powerful Reports: Easy-to-consume, detailed reports with insights can be generated
easily in-app.
14. Hi-Resolution Field Imagery: View hi-resolution imagery of registered land parcels via
sources like Google to check crop yield patterns.
15. Easy To Use Survey App: With a detailed but minimal UI, LS App delivers unparalleled
UX for field surveyors.

ANDRE is a survey data analysis automation product. It takes tabular data and returns compelling analysis reports with data visualizations and synthesis slides. It makes the analysis process seamless by focusing on the narratives rather than the numbers.
Here's how ANDRE revolutionizes the way we handle data:
- Narrative-Driven Analysis: Unlike traditional tools that focus solely on numeric outputs, ANDRE emphasizes the stories behind the numbers, providing a richer, more contextual understanding of the data.
- Seamless User Experience: With ANDRE, the journey from raw data to refined analysis is fluid and intuitive, eliminating complex steps and making advanced data analysis accessible to all levels of users.
Utilizing ANDRE can cut down professional analysis time by up to 90%.

ORI Excellence Platform is a supply chain analytics platform purpose-built for S&OP, S&OE, and integrated business planning. The platform includes 250+ pre-configured supply chain metrics, process workflows, exception management, scenario modeling, and demand planning capabilities — designed to support the full IBP cycle out of the box. ORI integrates with any ERP, BI, or planning system and includes a dedicated data support team that handles data integration, harmonization, and ongoing management. Key modules include demand planning with assumption-based forecasting and ML modeling, business analytics with self-service dashboards and tabular exploration, maturity assessments, strategy and financial integration, and collaborative S&OP process facilitation tools. ORI serves mid-size and enterprise manufacturers across food & beverage, CPG, automotive, pharma, and healthcare.