Best Database Monitoring Tools

How Many Database Monitoring Tools Products Does G2 Track?

Total Products under this Category: 130

Category Stats (Sep 2026)

  • Average Rating: 4.48/5 The average rating of products in this category, based on all submitted ratings
  • Top Trending Product: Monte Carlo (+0.14%) - Among all products in this category, Monte Carlo recorded the largest rating increase compared to last month

Last updated: September 15, 2026

How Does G2 Rank Database Monitoring Tools Products?

Why You Can Trust G2's Software Rankings:

  • 30 Analysts and Data Experts
  • 8,200+ Authentic Reviews
  • 130+ Products
  • Unbiased Rankings

G2's software rankings are built on verified user reviews, rigorous moderation, and a consistent research methodology maintained by a team of analysts and data experts. Each product is measured using the same transparent criteria, with no paid placement or vendor influence. While reviews reflect real user experiences, which can be subjective, they offer valuable insight into how software performs in the hands of professionals. Together, these inputs power the G2 Score, a standardized way to compare tools within every category.

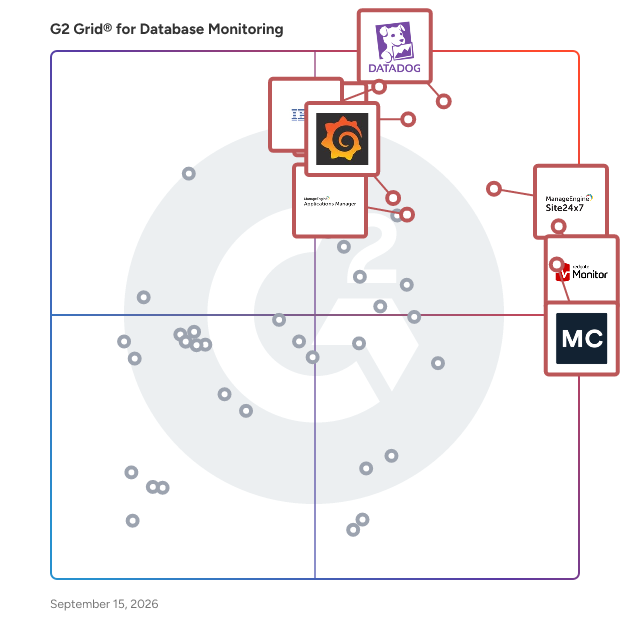
G2 Grid® for Database Monitoring Tools

G2 Grid® for Database Monitoring Tools plotting products by satisfaction and market presence

Highlighted products: Datadog, Redgate Monitor, Site24x7, IBM Instana, Monte Carlo, Dynatrace, Grafana Labs, and ManageEngine Applications Manager.

Underlying data: [Grid® JSON](https://www.g2.com/categories/database-monitoring/grids.json?focus%5B%5D=datadog&focus%5B%5D=redgate-monitor&focus%5B%5D=site24x7&focus%5B%5D=ibm-instana&focus%5B%5D=monte-carlo&focus%5B%5D=dynatrace&focus%5B%5D=grafana-labs&focus%5B%5D=manageengine-applications-manager)

Datadog

Datadog is the monitoring, security and analytics platform for developers, IT operations teams, security engineers and business users in the cloud age. The SaaS platform integrates and automates infrastructure monitoring, application performance monitoring and log management to provide unified, real-time observability of our customers' entire technology stack. Datadog is used by organizations of all sizes and across a wide range of industries to enable digital transformation and cloud migration, drive collaboration among development, operations, security and business teams, accelerate time to market for applications, reduce time to problem resolution, secure applications and infrastructure, understand user behavior and track key business metrics.

Average Rating: 4.4/5.0

Total Reviews: 715

How Do G2 Users Rate Datadog?

  • Monitoring: 9.1/10 (Category avg: 9.0/10)
  • Has the product been a good partner in doing business?: 8.5/10 (Category avg: 9.0/10)
  • Reporting: 8.8/10 (Category avg: 8.7/10)
  • Logging: 9.3/10 (Category avg: 8.6/10)

Who Is the Company Behind Datadog?

  • Seller: Datadog
  • Company Website:
  • Year Founded: 2010
  • HQ Location: New York
  • Twitter: @datadoghq
    51,207 Twitter followers
  • LinkedIn® Page: www.linkedin.com
    10,780 employees on LinkedIn®

Who Uses This Product?

  • Who Uses This: Software Engineer, DevOps Engineer
  • Top Industries: Information Technology and Services, Computer Software
  • Company Size: 47% Medium, 34% Large

What Do G2 Reviewers Say About Datadog?

AI-generated summary from verified user reviews

Pros
  • Users appreciate the ease of use of Datadog, enjoying intuitive dashboard creation and straightforward implementation.
  • Users appreciate the intuitive monitoring features of Datadog, enabling easy integration and insightful data analysis.
  • Users value the real-time monitoring capabilities of Datadog, enhancing oversight across various applications and infrastructures.
  • Users appreciate the user-friendly interface and robust integration capabilities of Datadog for effective monitoring.
  • Users value the intuitive dashboard creation in Datadog, which enhances monitoring and analysis efficiency.
Cons
  • Users find Datadog's pricing to be expensive, suggesting it should be more affordable given its features.
  • Users find pricing issues with Datadog, citing rapidly escalating costs and high subscription fees as concerns.
  • Users find the steep learning curve challenging, especially with rapidly evolving features and required knowledge.
  • Users find the costs to be unpredictable and excessively high, especially with data storage and additional features.
  • Users find learning difficulty in Datadog, noting that new users may require training to understand its complexities.

What Are Recent G2 Reviews of Datadog?

What Are G2 Users Discussing About Datadog?

Redgate Monitor

Redgate creates ingeniously simple software to help data professionals get the most value out of any database, anywhere, through the provision of end-to-end Database DevOps. More than 200,000 people globally, including 92% of the Fortune 100, trust Redgate to deliver ingeniously simple software. Redgate Monitor helps you manage your entire database estate from a single pane of glass. Monitor SQL Server, PostgreSQL, Oracle, MySQL, and MongoDB – on premises, in the cloud, or in hybrid environments. Get database observability to proactively mitigate potential risks with instant problem diagnosis and customizable alerting. No downtime, customer complaints, or wake-up calls at 3am Features of Redgate Monitor that customers love include: *Global Overview - See all your servers at a glance *Hybrid Monitoring - Confident cloud migrations, optimized performance databases *Diagnosis - Understand and resolve problems in an instant *Intelligent alerting - Know about issues first *Deployments - Unearth bad database deployments *Query impact - Find and fix problematic queries faster *Auditing - Ensure data security and regulatory compliance *Reporting - Keep your stakeholders in the loop *[New!] Redgate Assistant - purpose-built AI providing expert-grade diagnosis in plain language *[New!] MCP Server - Your Monitor data, now accessible in the AI tools your team already uses Find out more and see Redgate Monitor in action: https://www.red-gate.com/products/redgate-monitor/

Average Rating: 4.5/5.0

Total Reviews: 136

How Do G2 Users Rate Redgate Monitor?

  • Monitoring: 9.5/10 (Category avg: 9.0/10)
  • Has the product been a good partner in doing business?: 8.9/10 (Category avg: 9.0/10)
  • Reporting: 8.1/10 (Category avg: 8.7/10)
  • Logging: 8.8/10 (Category avg: 8.6/10)

Who Is the Company Behind Redgate Monitor?

  • Seller: Redgate Software
  • Company Website:
  • Year Founded: 1999
  • HQ Location: Cambridge, United Kingdom
  • Twitter: @redgate
    16,100 Twitter followers
  • LinkedIn® Page: www.linkedin.com
    555 employees on LinkedIn®

Who Uses This Product?

  • Who Uses This: DBA, Database Administrator
  • Top Industries: Financial Services, Computer Software
  • Company Size: 46% Medium, 30% Large

What Do G2 Reviewers Say About Redgate Monitor?

AI-generated summary from verified user reviews

Pros
  • Users value the ease of use of Redgate Monitor, highlighting its simple installation and user-friendly design.
  • Users appreciate the clear performance insights of Redgate Monitor, enabling proactive maintenance and quick issue resolution.
  • Users commend the reliable and easy-to-configure alerting system in Redgate Monitor for efficient monitoring of issues.
  • Users value the quick and detailed SQL query insights from Redgate Monitor, enhancing their diagnostics and maintenance efforts.
  • Users value the excellent customer support from Redgate Monitor, appreciating prompt resolutions and useful training materials.
Cons
  • Users find the licensing costs to be quite expensive, especially when monitoring unnecessary servers in a cluster.
  • Users find the inefficient alert system of Redgate Monitor annoying and lacking necessary customization options for notifications.
  • Users find the limited customization options frustrating, particularly regarding notifications and monitoring reports setup.
  • Users find the limited features of Redgate Monitor restrict their ability to customize and access comprehensive data.
  • Users find pricing issues concerning, particularly for organizations with large server environments that increase costs.

What Are Recent G2 Reviews of Redgate Monitor?

What Are G2 Users Discussing About Redgate Monitor?

Site24x7

ManageEngine Site24x7 offers unified cloud monitoring for DevOps and IT operations within small to large organizations. The solution monitors the experience of real users accessing websites and applications from desktop and mobile devices. In-depth monitoring capabilities enable DevOps teams to monitor and troubleshoot applications, servers and network infrastructure, including private and public clouds. End-user experience monitoring is done from more than 100 locations across the world and various wireless carriers.

Average Rating: 4.6/5.0

Total Reviews: 463

How Do G2 Users Rate Site24x7?

  • Monitoring: 9.3/10 (Category avg: 9.0/10)
  • Has the product been a good partner in doing business?: 8.9/10 (Category avg: 9.0/10)
  • Reporting: 8.7/10 (Category avg: 8.7/10)
  • Logging: 8.3/10 (Category avg: 8.6/10)

Who Is the Company Behind Site24x7?

  • Seller: Zoho
  • Year Founded: 1996
  • HQ Location: Austin, TX
  • Twitter: @Zoho
    137,880 Twitter followers
  • LinkedIn® Page: www.linkedin.com
    30,913 employees on LinkedIn®
  • Phone: +1 (888) 900-9646

Who Uses This Product?

  • Who Uses This: CEO, IT Manager
  • Top Industries: Information Technology and Services, Computer Software
  • Company Size: 46% Medium, 41% Small

What Do G2 Reviewers Say About Site24x7?

AI-generated summary from verified user reviews

Pros
  • Users appreciate the ease of use of Site24x7, making implementation and daily operations smooth and efficient.
  • Users appreciate the single pane of glass visibility in Site24x7, enhancing efficiency and monitoring flexibility.
  • Users appreciate the real-time monitoring capabilities of Site24x7, providing comprehensive oversight for networks and infrastructure.
  • Users value the extensive monitoring features of Site24x7, enabling efficient oversight of multiple resources from one interface.
  • Users enjoy the extensive visibility of Site24x7, appreciating its ease of setup and efficient monitoring capabilities.
Cons
  • Users face missing alerts and limited interface visibility, hindering their ability to monitor system efficiency effectively.
  • Users find the complexity of tool integration and plan options overwhelming, preferring a simplified default view.
  • Users find the pricing overwhelming and feel it could be more flexible for smaller businesses or startups.
  • Users find the learning curve for advanced features of Site24x7 challenging, impacting effective usage of the platform.
  • Users find the UI lacking modernity, making it difficult to adopt and navigate smoothly.

What Are Recent G2 Reviews of Site24x7?

What Are G2 Users Discussing About Site24x7?

IBM Instana

IBM Instana, now part of the Concert platform, discovers and maps all services, infrastructure, and their inter-dependencies automatically. Instana ingests all observability metrics, traces each request, profiles every process, and updates application dependency maps in real-time to deliver the context and actionable feedback needed by DevOps to optimize application performance, enable innovation and mitigate risk to help them add value and efficiency to the pipeline. IBM Instana is available on AWS Marketplace.

Average Rating: 4.4/5.0

Total Reviews: 468

How Do G2 Users Rate IBM Instana?

  • Monitoring: 9.4/10 (Category avg: 9.0/10)
  • Has the product been a good partner in doing business?: 8.5/10 (Category avg: 9.0/10)
  • Reporting: 8.8/10 (Category avg: 8.7/10)
  • Logging: 8.7/10 (Category avg: 8.6/10)

Who Is the Company Behind IBM Instana?

  • Seller: IBM
  • Company Website:
  • Year Founded: 1911
  • HQ Location: Armonk, New York, United States
  • Twitter: @IBMSecurity
    74,660 Twitter followers
  • LinkedIn® Page: www.linkedin.com
    344,328 employees on LinkedIn®

Who Uses This Product?

  • Who Uses This: Software Engineer, System Engineer
  • Top Industries: Information Technology and Services, Computer Software
  • Company Size: 40% Medium, 36% Large

What Do G2 Reviewers Say About IBM Instana?

AI-generated summary from verified user reviews

Pros
  • Users value the ease of use of IBM Instana, which simplifies app tracking and enhances performance analysis.
  • Users value the fast and comprehensive monitoring capabilities of IBM Instana, ensuring robust protection across all environments.
  • Users value the real-time monitoring of IBM Instana, appreciating its ease of use and robust dashboard features.
  • Users value the fast and effective monitoring capabilities of IBM Instana, ensuring comprehensive system protection and anomaly detection.
  • Users highlight the effortless setup of IBM Instana, enabling seamless monitoring of complex applications without manual configuration.
Cons
  • Users express that the pricing can accumulate quickly as their environments grow, making it a significant concern.
  • Users find the user interface complex, leading to a steeper learning curve and affecting overall usability.
  • Users find the learning curve challenging, particularly for new team members navigating the complex interface and features.
  • Users find the difficult learning curve of IBM Instana challenging, hindering quick adaptation and efficient use of the tool.
  • Many users find the pricing structure of IBM Instana to be expensive, particularly for smaller teams and startups.

What Are Recent G2 Reviews of IBM Instana?

What Are G2 Users Discussing About IBM Instana?

Dynatrace

Dynatrace is advancing observability for today’s digital businesses, helping to transform the complexity of modern digital ecosystems into powerful business assets. By leveraging AI-powered insights, Dynatrace enables organizations to analyze, automate, and innovate faster to drive their business forward. To learn more about how Dynatrace can help your business, visit www.dynatrace.com, visit our blog and follow us on LinkedIn and X @dynatrace.

Average Rating: 4.5/5.0

Total Reviews: 1,236

How Do G2 Users Rate Dynatrace?

  • Monitoring: 8.9/10 (Category avg: 9.0/10)
  • Has the product been a good partner in doing business?: 8.7/10 (Category avg: 9.0/10)
  • Reporting: 8.3/10 (Category avg: 8.7/10)
  • Logging: 8.6/10 (Category avg: 8.6/10)

Who Is the Company Behind Dynatrace?

  • Seller: Dynatrace
  • Year Founded: 2005
  • HQ Location: Boston, MA
  • Twitter: @Dynatrace
    18,668 Twitter followers
  • LinkedIn® Page: www.linkedin.com
    6,181 employees on LinkedIn®
  • Ownership: NYSE: DT

Who Uses This Product?

  • Who Uses This: Software Engineer, Senior Software Engineer
  • Top Industries: Information Technology and Services, Financial Services
  • Company Size: 69% Large, 23% Medium

What Do G2 Reviewers Say About Dynatrace?

AI-generated summary from verified user reviews

Pros
  • Users appreciate the ease of use of Dynatrace, enjoying seamless application instrumentation and comprehensive support.
  • Users value the insightful dashboarding of Dynatrace, enhancing executive views and simplifying monitoring processes.
  • Users value the comprehensive monitoring capabilities of Dynatrace, enhancing problem identification and prevention effectively.
  • Users value the effective debugging capabilities of Dynatrace, enhancing their ability to identify and resolve issues promptly.
  • Users value the robust analytics and integration features of Dynatrace, enhancing their monitoring and debugging capabilities.
Cons
  • Users find the steep learning curve of Dynatrace challenging, making it hard to fully utilize its features.
  • Users find that missing features in Dynatrace hinder detailed analysis and communication regarding updates and fixes.
  • Users find Dynatrace's complexity overwhelming, with a steep learning curve and costly pricing affecting usability.
  • Users find the learning difficulty challenging due to overwhelming information and inconsistencies in functionality.
  • Users find the costly nature of Dynatrace challenging, making it more suitable for large enterprises only.

What Are Recent G2 Reviews of Dynatrace?

What Are G2 Users Discussing About Dynatrace?

Monte Carlo

Monte Carlo is the agent trust platform, trusted by Nasdaq, Cisco, PepsiCo, and hundreds of enterprise organizations worldwide. Founded in 2019 and backed by leading investors, Monte Carlo pioneered data observability and has expanded into the full AI reliability stack. We're consistently ranked #1 in data observability on G2 — and we're built for what comes next. As enterprises scale from dozens to thousands of AI agents across mission-critical use cases, Monte Carlo monitors, troubleshoots, and improves both those agents and the underlying data powering them. Our platform covers the full trust stack — from the data pipelines feeding agents, to the context they retrieve, the decisions they make, and the outputs they produce — across four trust dimensions: context quality, performance, behavior, and outputs. Only Monte Carlo closes the full trust loop across both data and AI, and we meet enterprises wherever they are on the spectrum from human-guided oversight to fully autonomous operations. With 100+ integrations across Snowflake, Databricks, and the rest of your stack, you get full coverage without ripping anything out. Traditional monitoring tools stop at the pipeline or cover only one dimension of reliability — leaving teams to manually investigate, diagnose, and fix failures across disconnected tools. Monte Carlo closes that gap. Teams using Monte Carlo dramatically reduce time to detect and resolve data and AI incidents, scale monitoring coverage without scaling headcount, and build the internal trust that turns AI investments into real business outcomes. If your organization is serious enough about AI to put it in front of customers, executives, and critical decisions — Monte Carlo is the foundation it needs.

Average Rating: 4.3/5.0

Total Reviews: 544

How Do G2 Users Rate Monte Carlo?

  • Monitoring: 9.0/10 (Category avg: 9.0/10)
  • Has the product been a good partner in doing business?: 9.3/10 (Category avg: 9.0/10)
  • Reporting: 7.7/10 (Category avg: 8.7/10)
  • Logging: 7.8/10 (Category avg: 8.6/10)

Who Is the Company Behind Monte Carlo?

  • Seller: Monte Carlo
  • Company Website:
  • Year Founded: 2019
  • HQ Location: San Francisco, US
  • Twitter: @montecarlo_ai
    1,576 Twitter followers
  • LinkedIn® Page: www.linkedin.com
    550 employees on LinkedIn®

Who Uses This Product?

  • Who Uses This: Data Engineer, Senior Data Engineer
  • Top Industries: Financial Services, Computer Software
  • Company Size: 50% Large, 41% Medium

What Do G2 Reviewers Say About Monte Carlo?

AI-generated summary from verified user reviews

Pros
  • Users value the intuitive interface of Monte Carlo, finding it easy to navigate and utilize effectively.
  • Users appreciate the custom alerts and integration with Teams, enhancing data monitoring and stakeholder communication efficiently.
  • Users value the effective monitoring of Monte Carlo, catching data issues early and enhancing stakeholder communication.
  • Users value the custom alerting features in Monte Carlo for efficiently monitoring and notifying stakeholders about data issues.
  • Users value the ease of setting up alerts and anomaly detection in Monte Carlo for monitoring data quality.
Cons
  • Users find the lack of manual threshold settings for alerts limiting, impacting customization for their specific needs.
  • Users experience alert overload due to noisy initial settings, prompting the need for sensitivity adjustments and muted alerts.
  • Users find the inefficient alert system problematic, with issues in notification messages and usability improvements needed.
  • Users find the UX improvement necessary due to slow performance and disorganized features leading to confusion.
  • Users find limited functionality in Monte Carlo, especially regarding custom metrics and alert threshold settings.

What Are Recent G2 Reviews of Monte Carlo?

What Are G2 Users Discussing About Monte Carlo?

Grafana Labs

Grafana Labs provides an open and composable monitoring and observability stack built around Grafana, the leading open source technology for dashboards and visualization. There are more than 3,000 Grafana Labs customers, including Bloomberg, Citigroup, Dell Technologies, Salesforce, and TomTom, and more than 1 million active instances of Grafana around the world. Grafana Labs helps companies manage their observability strategies with the LGTM Stack, which can be run fully managed with Grafana Cloud or self-managed with the Grafana Enterprise offerings, both featuring scalable metrics (Grafana Mimir), logs (Grafana Loki), and traces (Grafana Tempo) as well as extensive enterprise data source plugins, dashboard management, alerting, reporting, and security. Grafana Labs is backed by leading investors Lightspeed Venture Partners, Lead Edge Capital, GIC, Sequoia Capital, Coatue, and J.P. Morgan. Follow Grafana Labs on LinkedIn and Twitter or visit https://grafana.com.

Average Rating: 4.5/5.0

Total Reviews: 199

How Do G2 Users Rate Grafana Labs?

  • Monitoring: 9.7/10 (Category avg: 9.0/10)
  • Has the product been a good partner in doing business?: 8.3/10 (Category avg: 9.0/10)
  • Reporting: 8.8/10 (Category avg: 8.7/10)
  • Logging: 8.5/10 (Category avg: 8.6/10)

Who Is the Company Behind Grafana Labs?

  • Seller: Grafana Labs
  • Year Founded: 2014
  • HQ Location: New York
  • Twitter: @grafana
    71,444 Twitter followers
  • LinkedIn® Page: www.linkedin.com
    1,907 employees on LinkedIn®

Who Uses This Product?

  • Who Uses This: Software Engineer, Senior Software Engineer
  • Top Industries: Information Technology and Services, Computer Software
  • Company Size: 48% Medium, 26% Large

What Do G2 Reviewers Say About Grafana Labs?

AI-generated summary from verified user reviews

Pros
  • Users value the intuitive and flexible interface of Grafana for creating interactive and seamless dashboards.
  • Users appreciate the ease of use of Grafana, enjoying seamless monitoring and intuitive dashboard creation.
  • Users value the intuitive and flexible dashboard interface of Grafana, enhancing their data visualization and monitoring experiences.
  • Users value the real-time monitoring capabilities of Grafana Labs, enhancing visibility and responsiveness for complex metrics.
  • Users value Grafana's flexibility and clarity in monitoring, making complex data visualization easy and effective.
Cons
  • Users find the learning curve steep, with challenging setup and limited documentation impacting accessibility for newcomers.
  • Users find the complex setup of Grafana Labs challenging, especially when configuring data sources and writing queries.
  • Users find the difficult learning curve to be a significant challenge, especially for advanced features and configurations.
  • Users find the learning difficulty of Grafana challenging, particularly in navigating the interface and setup processes.
  • Users find the complexity of initial setup and query writing in Grafana Labs to be challenging and time-consuming.

What Are Recent G2 Reviews of Grafana Labs?

What Are G2 Users Discussing About Grafana Labs?

ManageEngine Applications Manager

ManageEngine Applications Manager is an application performance & IT infrastructure monitoring solution that is designed to combat modern infrastructure problems and ensure that your business and end users are unaffected by substandard performance and downtime. By leveraging deep application performance monitoring with byte-code instrumentation, infrastructure monitoring, hybrid cloud monitoring, and digital experience monitoring from a single console, IT and DevOps teams will be able to gain code-level insights, automate their processes, pinpoint & resolve performance issues, and deliver better business outcomes. Overall, our product will help businesses optimize application usage & revenue, reduce MTTR, improve DevOps processes, migrate to the cloud with confidence, respond to incidents faster, and ensure seamless user experiences.

Average Rating: 4.7/5.0

Total Reviews: 111

How Do G2 Users Rate ManageEngine Applications Manager?

  • Monitoring: 9.6/10 (Category avg: 9.0/10)
  • Has the product been a good partner in doing business?: 9.3/10 (Category avg: 9.0/10)
  • Reporting: 9.4/10 (Category avg: 8.7/10)
  • Logging: 9.1/10 (Category avg: 8.6/10)

Who Is the Company Behind ManageEngine Applications Manager?

  • Seller: Zoho
  • Year Founded: 1996
  • HQ Location: Austin, TX
  • Twitter: @Zoho
    137,880 Twitter followers
  • LinkedIn® Page: www.linkedin.com
    30,913 employees on LinkedIn®
  • Phone: +1 (888) 900-9646

Who Uses This Product?

  • Top Industries: Information Technology and Services, Computer Software
  • Company Size: 46% Medium, 42% Large

What Do G2 Reviewers Say About ManageEngine Applications Manager?

AI-generated summary from verified user reviews

Pros
  • Users appreciate the real-time monitoring capabilities of ManageEngine Applications Manager, enhancing visibility and troubleshooting efficiency.
  • Users value the real-time monitoring capabilities of ManageEngine Applications Manager, enhancing troubleshooting and application health visibility.
  • Users value the real-time monitoring features of ManageEngine Applications Manager for proactive issue resolution and performance tracking.
  • Users value the real-time monitoring capabilities of ManageEngine Applications Manager, enhancing their ability to troubleshoot proactively.
  • Users value the real-time visibility in ManageEngine Applications Manager, enabling proactive issue resolution and performance monitoring.
Cons
  • Users experience limited features that hinder integration and scalability, making it hard to monitor efficiently.
  • Users face feature limitations in ManageEngine Applications Manager, impacting integration and scalability for large enterprises.
  • Users face integration issues that hinder scalability and complicate monitoring across diverse applications in large environments.
  • Users find the learning curve steep for ManageEngine Applications Manager, complicating setup and utilization of advanced features.
  • Users find the initial setup complexity to be time-consuming and challenging, especially in larger environments.

What Are Recent G2 Reviews of ManageEngine Applications Manager?

What Are G2 Users Discussing About ManageEngine Applications Manager?

SolarWinds Database Observability

SolarWinds Database Observability brings together SolarWinds database monitoring and performance management capabilities for organizations running mixed database estates across on-premises and cloud environments. The portfolio includes self-hosted and SaaS offerings and supports relational, open-source, and NoSQL databases, including SQL Server, Oracle, MySQL, PostgreSQL, MongoDB, Redis, Amazon Aurora, Amazon RDS, Azure SQL, and Google Cloud SQL. Designed for database administrators, platform teams, and IT operations teams, SolarWinds Database Observability helps users monitor database health, analyze query performance, troubleshoot waits, blocking, and deadlocks, and investigate performance problems with greater speed and confidence. Across the portfolio, teams can use capabilities such as query analysis, workload profiling, execution plan analysis, historical performance analysis, anomaly detection, alerting, and reporting to identify issues before they become larger operational problems. It also helps teams connect database performance to the wider IT environment by correlating database activity with CPU, memory, disk I/O, and surrounding infrastructure context. Integrations with tools and services such as SolarWinds Service Desk, PagerDuty, ServiceNow, Microsoft Teams, OpsGenie, and webhooks support faster notification, escalation, and response workflows. This broader context is especially useful for organizations trying to reduce troubleshooting silos and improve collaboration between database and infrastructure teams. The primary value of SolarWinds Database Observability is that it gives teams deeper visibility into database behavior across diverse environments while helping them diagnose slowdowns, tune performance, and resolve issues more efficiently. Rather than positioning database monitoring as a secondary add-on, it delivers database-focused depth alongside broader IT context, making it well suited to organizations that need strong database performance management without unnecessary complexity.

Average Rating: 4.5/5.0

Total Reviews: 224

How Do G2 Users Rate SolarWinds Database Observability?

  • Monitoring: 9.4/10 (Category avg: 9.0/10)
  • Has the product been a good partner in doing business?: 8.9/10 (Category avg: 9.0/10)
  • Reporting: 8.6/10 (Category avg: 8.7/10)
  • Logging: 9.0/10 (Category avg: 8.6/10)

Who Is the Company Behind SolarWinds Database Observability?

  • Seller: SolarWinds Worldwide LLC
  • Company Website:
  • Year Founded: 1999
  • HQ Location: Austin, TX
  • Twitter: @solarwinds
    19,570 Twitter followers
  • LinkedIn® Page: www.linkedin.com
    2,864 employees on LinkedIn®

Who Uses This Product?

  • Top Industries: Information Technology and Services, Computer Software
  • Company Size: 42% Medium, 38% Large

What Do G2 Reviewers Say About SolarWinds Database Observability?

AI-generated summary from verified user reviews

Pros
  • Users value the real-time monitoring of Database Observability, significantly improving resource allocation and performance management.
  • Users value the excellent monitoring capabilities of SolarWinds Database Observability, enabling efficient SQL query analysis and visibility.
  • Users appreciate the stellar visibility into database performance, enabling quick identification of issues and proactive management.
  • Users appreciate the ease of use of SolarWinds Database Observability, enabling quick setup and intuitive monitoring for efficient management.
  • Users appreciate the real-time insights provided by SolarWinds Database Observability, enhancing efficient and proactive database management.
Cons
  • Users find the learning curve steep for new teams, making initial setup and understanding metrics challenging.
  • Users find the steep learning curve challenging, particularly for new teams adapting to extensive metrics and configurations.
  • Users encounter a difficult setup with SolarWinds Database Observability, requiring significant time and effort to configure properly.
  • Users find the cost prohibitive for smaller teams, making it less accessible for those with limited budgets.
  • Users find the initial setup and learning curve complex, particularly challenging for teams new to database monitoring tools.

What Are Recent G2 Reviews of SolarWinds Database Observability?

What Are G2 Users Discussing About SolarWinds Database Observability?

Checkmk

Checkmk is a full-stack monitoring and observability platform designed to provide unified visibility into hybrid IT infrastructures. With more than 2,000 built-in integrations, it offers broad coverage across networks, servers, cloud workloads, Kubernetes and applications. The platform is highly automated, featuring auto-discovery of hosts and services and rule-based configuration to reduce manual setup. It is highly scalable, capable of efficiently monitoring thousands of hosts and millions of services. A central web-based interface allows users to manage configuration, visualize data with customizable dashboards, and track system performance over time. Checkmk is available as packages for all common Linux distributions, as a virtual or physical appliance, through AWS and Azure Marketplace images, or as SaaS. Checkmk is available in four editions: Checkmk Community offers free and open source monitoring for small infrastructures. Checkmk Pro allows for monitoring at speed and scale for data center infrastructures. Checkmk Ultimate offers full-stack observability for hybrid and cloud-native infrastructures which is also available with multi-tenancy and data segregation to support security and compliance. And Checkmk Cloud for full-stack observability for hybrid and cloud-native infrastructures in a SaaS platform. Available extensions include synthetic monitoring and OpenTelemetry for application monitoring. The Checkmk Relay enables secure data collection for segmented networks using outbound-only communication, supporting fully air-gapped and zero-inbound monitoring deployments. Checkmk supports integration with ITSM tools and third-party platforms, enabling automatic ticket creation and consistent alerting. Features such as forecasting, capacity planning, and asset inventory as well as lifecycle management and auto-registration help teams manage dynamic IT environments. Monitoring capabilities: - Monitoring of hybrid infrastructures: cloud, on-premises, virtual, and container environments. - 2000+ built-in integrations networks, servers, cloud workloads, Kubernetes and applications out-of-the-box dashboards provide key metrics for AWS and Azure environments, Linux and Windows servers, and Kubernetes clusters. - Automated discovery and configuration. - Alerting with native ITSM integrations. Operational benefits: - Provides insights into system health, capacity trends, and future resource needs through built-in assessments and forecasting tools. - Reduces manual effort with auto-discovery, rule-based configuration, and centralized agent management as well as auto-registration and host lifecycle management. - Accelerates incident response time by using custom self-healing workflows via the ‘Alert Handler’. - Allows creation of tailored dashboards and views to focus on the most relevant metrics for each team. - Maintains an up-to-date inventory of hardware and software assets, enriched with live monitoring data. - Supports distributed monitoring and can handle massive amounts of data. Why choose Checkmk? - Cost Efficiency: Transparent pricing model with a strong price-performance ratio - Security: Meets stringent security requirements, including fully air-gapped deployments and zero-inbound monitoring. - Visibility: Delivers broad and deep visibility with flexible deployment options. - Scalability: Scales efficiently to support large, distributed environments with high host and service counts. - Extensibility: Supports custom plug-ins, integrations, synthetic monitoring to monitor you applications from the user’s perspective and OpenTelemetry for application monitoring. Customers include: Adobe, Cloudera, Fujitsu, Siemens, Orange, VW, HP, Zalando, Fitbit, NEC, Continental, NHL, Capgemini, Sixt, Intesa SanPaolo

Average Rating: 4.7/5.0

Total Reviews: 295

How Do G2 Users Rate Checkmk?

  • Monitoring: 8.9/10 (Category avg: 9.0/10)
  • Has the product been a good partner in doing business?: 9.0/10 (Category avg: 9.0/10)
  • Reporting: 7.3/10 (Category avg: 8.7/10)
  • Logging: 7.5/10 (Category avg: 8.6/10)

Who Is the Company Behind Checkmk?

  • Seller: Checkmk
  • Company Website:
  • Year Founded: 2007
  • HQ Location: Munich, DE
  • Twitter: @checkmk
    1,755 Twitter followers
  • LinkedIn® Page: www.linkedin.com
    232 employees on LinkedIn®

Who Uses This Product?

  • Who Uses This: IT Engineer, Systemadministrator
  • Top Industries: Information Technology and Services, Computer & Network Security
  • Company Size: 42% Medium, 40% Large

What Do G2 Reviewers Say About Checkmk?

AI-generated summary from verified user reviews

Pros
  • Users appreciate the ease of use of Checkmk, finding it quick to deploy and well-documented.
  • Users commend Checkmk for its flexibility and powerful monitoring capabilities, effectively managing diverse IT infrastructures.
  • Users appreciate the comprehensive monitoring capabilities of Checkmk, enabling effective oversight of diverse IT environments.
  • Users value the flexibility and customization of Checkmk, making it a powerful solution tailored to their needs.
  • Users value Checkmk for its real-time monitoring capabilities, allowing efficient oversight of diverse systems and applications.
Cons
  • Users find the steep learning curve challenging, making onboarding difficult for non-regular users and complicating their experience.
  • Users find difficult learning due to complex customization and limited data insights in Checkmk, affecting usability.
  • Users find the configuration process overly complex, especially during onboarding for new and non-regular users.
  • Users find the learning difficulty steep due to complex configurations and lacking intuitive documentation for advanced features.
  • Users find the complex setup of Checkmk challenging, especially for newcomers unfamiliar with the system.

What Are Recent G2 Reviews of Checkmk?

What Are G2 Users Discussing About Checkmk?

SolarWinds Observability

SolarWinds® Observability is a comprehensive full-stack observability solution designed to meet the diverse needs of modern organizations, regardless of their size. This solution provides deep visibility into hybrid ecosystems, enabling users to monitor and manage both on-premises and cloud environments effectively. By optimizing performance and ensuring availability across distributed hybrid IT infrastructures, SolarWinds Observability supports organizations in navigating the complexities of their IT environments. Targeted at IT professionals and organizations that require robust monitoring capabilities, SolarWinds Observability caters to a wide range of use cases. It is particularly beneficial for businesses operating in hybrid environments, where the integration of on-premises and cloud resources is essential. The solution allows users to gain a holistic view of their networks, applications, databases, and user experiences, thereby facilitating better decision-making and operational efficiency. This is especially crucial in today’s fast-paced digital landscape, where downtime can significantly impact service reliability and customer satisfaction. One of the standout features of SolarWinds Observability is its built-in intelligence powered by AIOps capabilities. This functionality accelerates issue remediation by enabling users to detect, troubleshoot, and resolve problems more efficiently. The advanced predictive analysis and anomaly-based alerts help organizations proactively address potential issues before they escalate, ultimately reducing downtime and enhancing service reliability. Additionally, the solution's log pattern analysis further streamlines the troubleshooting process, allowing IT teams to focus on strategic initiatives rather than being bogged down by operational challenges. SolarWinds Observability offers flexibility in deployment, providing users with the option to choose between self-hosted and SaaS models. The self-hosted option integrates seamlessly with other SolarWinds services, such as security and storage monitoring, while the SaaS option is tailored for deeper monitoring of custom and cloud-based applications. This adaptability ensures that organizations can select the deployment method that best aligns with their operational needs and infrastructure. Moreover, SolarWinds Observability stands out by consolidating multiple monitoring tools into a single, integrated solution. This not only simplifies the monitoring process but also helps organizations reduce costs associated with managing disparate systems. By offering comprehensive visibility across hybrid IT environments, SolarWinds Observability empowers organizations to optimize their operations and enhance overall performance.

Average Rating: 4.3/5.0

Total Reviews: 826

How Do G2 Users Rate SolarWinds Observability?

  • Monitoring: 9.0/10 (Category avg: 9.0/10)
  • Has the product been a good partner in doing business?: 8.3/10 (Category avg: 9.0/10)
  • Reporting: 7.8/10 (Category avg: 8.7/10)
  • Logging: 8.9/10 (Category avg: 8.6/10)

Who Is the Company Behind SolarWinds Observability?

  • Seller: SolarWinds Worldwide LLC
  • Company Website:
  • Year Founded: 1999
  • HQ Location: Austin, TX
  • Twitter: @solarwinds
    19,570 Twitter followers
  • LinkedIn® Page: www.linkedin.com
    2,864 employees on LinkedIn®

Who Uses This Product?

  • Who Uses This: Network Engineer, Network Administrator
  • Top Industries: Information Technology and Services, Hospital & Health Care
  • Company Size: 44% Large, 35% Medium

What Do G2 Reviewers Say About SolarWinds Observability?

AI-generated summary from verified user reviews

Pros
  • Users love the intuitive interface of SolarWinds Observability, making system management and monitoring effortless and efficient.
  • Users appreciate the comprehensive visibility of SolarWinds Observability, simplifying performance monitoring across diverse environments.
  • Users appreciate the intuitive user interface of SolarWinds, enhancing the management and visibility of network performance.
  • Users love the intuitive dashboards and alerts of SolarWinds Observability, enhancing system management and monitoring efficiency.
  • Users love the visibility provided by SolarWinds Observability, thanks to its unified and intuitive dashboards for monitoring.
Cons
  • Users find the complex setup of SolarWinds Observability challenging, requiring significant technical expertise and time investment.
  • Users face a significant learning curve with SolarWinds Observability, complicating the use of advanced features and integrations.
  • Users are frustrated with the poor customer support, often finding it unhelpful for integration and troubleshooting issues.
  • Users experience usability issues with SolarWinds Observability, including a cluttered interface and a steep learning curve.

What Are Recent G2 Reviews of SolarWinds Observability?

What Are G2 Users Discussing About SolarWinds Observability?

Rakuten SixthSense Observability

In today's digital landscape, businesses need a powerful and comprehensive Application Performance Monitoring (APM) solution to stay ahead of the curve. Introducing Rakuten SixthSense Observability - a next-generation APM tool that transforms the way you monitor, analyze, and optimize your applications and infrastructure. With its robust suite of features and advanced analytics, Rakuten SixthSense Observability empowers you to proactively identify and resolve issues, streamline operations, and enhance customer experiences. Key Capabilities: • Comprehensive Monitoring and Alerting: Rakuten SixthSense Observability offers end-to-end monitoring of your applications, infrastructure, and network performance. With real-time alerting and customizable dashboards, you can quickly detect issues and gain actionable insights into the health and performance of your systems. • Distributed Tracing and Correlation: Gain full visibility into your application's performance with distributed tracing, which tracks transactions and requests across multiple services and components. This feature helps you identify bottlenecks, latency issues, and errors, making it easier to optimize your application and enhance customer experiences. • Anomaly Detection and Machine Learning: Leverage Rakuten SixthSense's advanced machine learning capabilities to automatically identify unusual patterns and deviations in application performance and resource utilization. This proactive approach enables you to detect and resolve issues before they impact your business and customers. • Advanced Analytics and Visualization: Rakuten SixthSense's rich data visualization and analytics tools allow you to dive deep into your application performance data. Generate custom reports, analyze trends, and uncover hidden patterns that can drive continuous improvement and optimization. • Log Management and Integration: Effortlessly collect, analyze, and store logs from various sources with Rakuten SixthSense's integrated log management feature. This seamless integration enables you to correlate log data with performance metrics and traces, providing a comprehensive understanding of your application's behaviour. • Scalability and Flexibility: Rakuten SixthSense Observability is built to scale with your growing business needs, supporting a wide range of applications, services, and infrastructure. Its flexible architecture allows you to customize the tool to your specific requirements and integrate it with other monitoring and observability solutions. Current Feature set: • Application Performance Monitoring: Full stack visibility across Java, PHP, Node.js, Python, Go and a lot more! Key Features include, Distributed Tracing, Profiling, Database Monitoring • Infrastructure Monitoring: Get a birds-eye view of your infrastructure health and gain granular insights with easy deployment Key Features include Kubernetes, VMs, Web Servers, Cloud Integrations • Digital Experience Monitoring: Improve the end-user experience of your applications mapped with contextual information of application performance metrics • Browser Monitoring: Metrics to optimize end users’ experience and help in improving application performance. • Mobile Monitoring: Monitor crashes, performance & usage metrics for your mobile applications • Synthetic Monitoring: Stimulate end-user transactions using low code, no code test scripts • VM Monitoring: VM monitoring capability lets you view your infrastructure performance and health of servers, virtual machines, containers, databases etc. at a glance. • SixthSense Cognitive Engine: Modern observability and the proactive approach using artificial intelligence. The application uses different AI/ML algorithms that can predict performance metrics with an accuracy of up to 98% and a confidence level of 90%.

Average Rating: 4.6/5.0

Total Reviews: 52

How Do G2 Users Rate Rakuten SixthSense Observability?

  • Monitoring: 9.5/10 (Category avg: 9.0/10)
  • Has the product been a good partner in doing business?: 9.2/10 (Category avg: 9.0/10)
  • Reporting: 9.6/10 (Category avg: 8.7/10)
  • Logging: 9.4/10 (Category avg: 8.6/10)

Who Is the Company Behind Rakuten SixthSense Observability?

Who Uses This Product?

  • Who Uses This: Senior Software Engineer
  • Top Industries: Information Technology and Services, Computer Games
  • Company Size: 47% Large, 38% Medium

What Do G2 Reviewers Say About Rakuten SixthSense Observability?

AI-generated summary from verified user reviews

Pros
  • Users appreciate the deep visibility offered by Rakuten SixthSense, enhancing application performance and proactively managing issues.
  • Users value the effective alerting system for seamless monitoring and quick resolution of issues in one dashboard.
  • Users value the excellent customer support of Rakuten SixthSense, enhancing their overall experience and productivity.
  • Users appreciate the ease of use of Rakuten SixthSense Observability, enabling quick identification of issues without hassle.
  • Users find the implementation ease of Rakuten SixthSense Observability impressive, allowing quick access to essential monitoring tools.
Cons
  • Users find the complex setup of Rakuten SixthSense Observability requires significant onboarding effort for optimal use.
  • Users find the documentation lacking, making onboarding and setup more challenging than necessary.
  • Users often face false positive alerts and desire better functionality for error monitoring and dashboard notifications.
  • Users report experiencing inefficient alerts, citing false positives and a lack of preferred error record displays.
  • Users note that the documentation needs improvement, which impacts their ability to utilize the tool effectively.

What Are Recent G2 Reviews of Rakuten SixthSense Observability?

Redis Cloud

Redis Cloud is our fully-managed Redis Enterprise service, delivering unmatched speed, simplicity, and scalability. It's perfect for cloud-native applications requiring real-time data processing, without the hassle of managing infrastructure. Redis Cloud surpasses Redis-compatible cloud services built on open source such as Amazon ElastiCache and Google Cloud Memorystore by offering enterprise-grade features like active-active geo-distribution, advanced query and search capabilities, seamless data synchronization, and multi-cloud support.

Average Rating: 4.6/5.0

Total Reviews: 42

How Do G2 Users Rate Redis Cloud?

  • Monitoring: 9.2/10 (Category avg: 9.0/10)
  • Has the product been a good partner in doing business?: 9.2/10 (Category avg: 9.0/10)
  • Reporting: 9.4/10 (Category avg: 8.7/10)
  • Logging: 9.4/10 (Category avg: 8.6/10)

Who Is the Company Behind Redis Cloud?

  • Seller: Redis
  • Year Founded: 2011
  • HQ Location: San Francisco, CA
  • Twitter: @Redisinc
    44,002 Twitter followers
  • LinkedIn® Page: www.linkedin.com
    1,542 employees on LinkedIn®

Who Uses This Product?

  • Top Industries: Information Technology and Services, Computer Software
  • Company Size: 50% Small, 41% Medium

What Are Recent G2 Reviews of Redis Cloud?

What Are G2 Users Discussing About Redis Cloud?

Metaplane

Metaplane is the end-to-end data observability tool that helps data teams know when things break, what went wrong, and how to fix it. Built for the modern data stack, we empower data teams to start monitoring their data in minutes. We’re backed by world-class investors and advisors, including Y Combinator, Khosla Ventures, HubSpot, Clearbit, Okta, Flybridge, and Drift. Metaplane helps you build trust in your company's data, increase your team's awareness of the state of data quality, and ultimately save engineering time. Key features include anomaly detection, usage analytics, data lineage, and custom SQL tests. Integrations include Snowflake, Redshift, BigQuery, dbt, Looker, Mode, Metabase, Tableau, Postgres, MySQL, Slack, and PagerDuty.

Average Rating: 4.8/5.0

Total Reviews: 116

How Do G2 Users Rate Metaplane?

  • Monitoring: 9.6/10 (Category avg: 9.0/10)
  • Has the product been a good partner in doing business?: 9.9/10 (Category avg: 9.0/10)
  • Reporting: 8.7/10 (Category avg: 8.7/10)
  • Logging: 8.3/10 (Category avg: 8.6/10)

Who Is the Company Behind Metaplane?

  • Seller: Datadog
  • Company Website:
  • Year Founded: 2010
  • HQ Location: New York
  • Twitter: @datadoghq
    51,207 Twitter followers
  • LinkedIn® Page: www.linkedin.com
    10,780 employees on LinkedIn®

Who Uses This Product?

  • Who Uses This: Data Engineer
  • Top Industries: Computer Software, Information Technology and Services
  • Company Size: 66% Medium, 22% Small

What Do G2 Reviewers Say About Metaplane?

AI-generated summary from verified user reviews

Pros
  • Users appreciate the ease of use of Metaplane, allowing for quick integration and effective anomaly detection.
  • Users value the easy integrations of Metaplane, enhancing their data monitoring and overall experience with seamless setup.
  • Users value effective monitoring with Metaplane, allowing proactive issue resolution and enhancing confidence in data reliability.
  • Users highlight the quick alerts feature of Metaplane, enhancing data issue resolution and monitoring efficiency.
  • Users value the proactive anomaly detection of Metaplane, enhancing data quality and saving significant time and effort.
Cons
  • Users find the limited customization options for complex rules somewhat restrictive, impacting their monitoring precision.
  • Users find that alert management can be overly sensitive, leading to noise and potential notifications fatigue.
  • Users experience inefficient alert systems in Metaplane, leading to noise and occasional overlooking of important notifications.
  • Users find the complex setup of Metaplane time-consuming, especially when fine-tuning monitors for specific datasets.
  • Users find the difficult setup of Metaplane time-consuming, especially when fine-tuning alerts for complex datasets.

What Are Recent G2 Reviews of Metaplane?

Paessler PRTG

Your infrastructure is complex. Your monitoring tool shouldn't be. Paessler PRTG delivers mission-critical visibility across IT and OT environments, deploying in minutes, not months. Whether you're managing servers, switches, virtual machines, cloud services, or industrial systems, PRTG monitors everything from a single platform, so your team always knows what's running, what's struggling, and what needs attention, before users do. Fast to deploy. Easy to run. Auto-discovery finds devices on your network automatically, and 300+ pre-configured sensors cover the most common infrastructure components out of the box. Support for all major protocols (SNMP, WMI, REST APIs, SSH, NetFlow, and more) means PRTG fits into your existing environment without forcing changes to it. Built for lean teams under real pressure. Customizable dashboards give instant visibility across your entire landscape. Flexible alerting (via email, SMS, push notification, or third-party integrations) ensures the right people are notified the moment something goes wrong. Historical trend data helps you spot patterns and plan ahead, not just react. Scales on your terms. From a single site to distributed multi-location environments, PRTG grows with your organization. Available as an on-premises installation or a hosted solution, it adapts to your infrastructure and your IT policies, no rip-and-replace required. Trusted by more than 500,000 users across 190+ countries since 1997, Paessler PRTG is the monitoring standard for IT professionals who need results, not complexity.

Average Rating: 4.7/5.0

Total Reviews: 207

How Do G2 Users Rate Paessler PRTG?

  • Monitoring: 9.5/10 (Category avg: 9.0/10)
  • Has the product been a good partner in doing business?: 8.8/10 (Category avg: 9.0/10)
  • Reporting: 8.6/10 (Category avg: 8.7/10)
  • Logging: 8.9/10 (Category avg: 8.6/10)

Who Is the Company Behind Paessler PRTG?

  • Seller: Paessler GmbH
  • Company Website:
  • Year Founded: 1997
  • HQ Location: Nuremberg, Germany
  • LinkedIn® Page: www.linkedin.com
    400 employees on LinkedIn®

Who Uses This Product?

  • Who Uses This: Software Engineer, Network Administrator
  • Top Industries: Information Technology and Services, Telecommunications
  • Company Size: 52% Medium, 35% Large

What Do G2 Reviewers Say About Paessler PRTG?

AI-generated summary from verified user reviews

Pros
  • Users find Paessler PRTG's ease of use impressive, enjoying intuitive setup and customizable features for effective monitoring.
  • Users value the reliable monitoring capabilities of PRTG, enjoying its customizable sensors and mobile accessibility.
  • Users highlight the reliable monitoring capabilities of PRTG, enabling efficient tracking of critical network infrastructure.
  • Users value the robust alerting system of PRTG, ensuring immediate notifications for any network disruptions or issues.
  • Users find the easy setup of Paessler PRTG efficient, enabling quick monitoring of their network infrastructure.
Cons
  • Users find the high acquisition cost problematic, complicating the decision to monitor additional metrics and services.
  • Users report slow performance with large reports and dashboards, affecting usability during peak access times.
  • Users report user interface issues with PRTG, finding the web interface dated and the mobile app lacking polish.
  • Users find the learning curve for advanced features of PRTG to be steeper than expected, especially for new users.
  • Users find the complex setup of PRTG challenging, requiring extensive experimentation and fine-tuning for optimal performance.

What Are Recent G2 Reviews of Paessler PRTG?

What Are G2 Users Discussing About Paessler PRTG?

Tian Lin
TL
Researched and written by Tian Lin
Updated March 10, 2026