Best Location Intelligence Software - Page 19

How Many Location Intelligence Software Products Does G2 Track?

Total Products under this Category: 302

Category Stats (Sep 2026)

  • Average Rating: 4.4/5 (↑0.01 vs Aug 2026) The average rating of products in this category, based on all submitted ratings
  • Top Trending Product: Smappen (+9.51%) - Among all products in this category, Smappen recorded the largest rating increase compared to last month

Last updated: September 01, 2026

How Does G2 Rank Location Intelligence Software Products?

Why You Can Trust G2's Software Rankings:

  • 30 Analysts and Data Experts
  • 36,800+ Authentic Reviews
  • 302+ Products
  • Unbiased Rankings

G2's software rankings are built on verified user reviews, rigorous moderation, and a consistent research methodology maintained by a team of analysts and data experts. Each product is measured using the same transparent criteria, with no paid placement or vendor influence. While reviews reflect real user experiences, which can be subjective, they offer valuable insight into how software performs in the hands of professionals. Together, these inputs power the G2 Score, a standardized way to compare tools within every category.

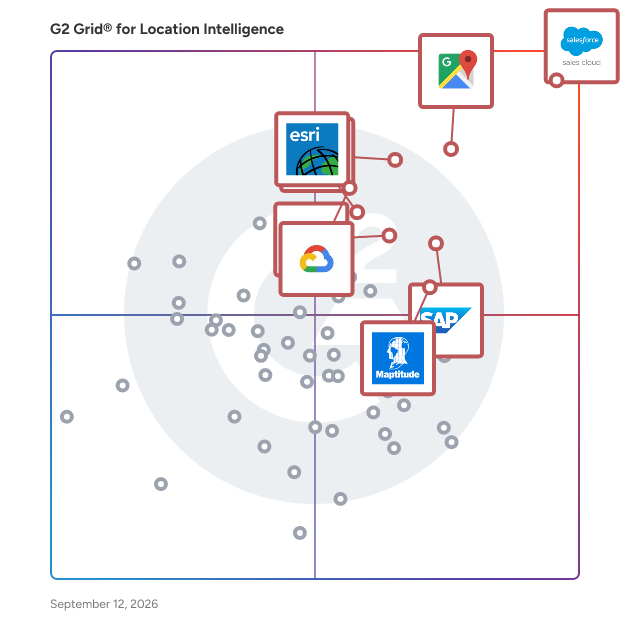
G2 Grid® for Location Intelligence Software

G2 Grid® for Location Intelligence Software plotting products by satisfaction and market presence

Highlighted products: Agentforce Sales (formerly Salesforce Sales Cloud), Google Maps Platform, Tableau, SAP HANA Cloud, Google Earth Engine, Alteryx, Esri ArcGIS, and Maptitude.

Underlying data: [Grid® JSON](https://www.g2.com/categories/location-intelligence/grids.json?focus%5B%5D=agentforce-sales-formerly-salesforce-sales-cloud&focus%5B%5D=google-maps-platform&focus%5B%5D=tableau&focus%5B%5D=sap-hana-cloud-2025-10-01&focus%5B%5D=google-earth-engine&focus%5B%5D=alteryx&focus%5B%5D=esri-arcgis&focus%5B%5D=maptitude)

PoiData

PoiData.io provides business and location data from around the world to help companies make better decisions. We offer detailed and reliable information about businesses across many industries and countries.

Who Is the Company Behind PoiData?

Proximitii

Proximitii connects consumers with location-centric lifestyle data along with flexible mapping solutions.

Who Is the Company Behind Proximitii?

QSMAP - Geolocation for NetSuite

QSMAP is NetSuite integration that unlocks geolocation data and geographical insights of a Netsuite contact database. Results are displayed on a custom google maps interface withing the Netsuite dashboard

Who Is the Company Behind QSMAP - Geolocation for NetSuite?

  • Seller: QSMAP
  • Year Founded: 2015
  • HQ Location: toronto, CA
  • LinkedIn® Page: www.linkedin.com
    1 employees on LinkedIn®

Who Uses This Product?

  • Company Size: 100% Large

Relu AI Systems

Relusys delivers end to end image recognition solutions that are designed to enhance your business process.

Who Is the Company Behind Relu AI Systems?

RetailSonar

The RetailSonar platform helps retailers and CPOs make smarter location decisions. It combines market data, internal sales data, and predictive models to answer three key questions: 1. Where should I improve my existing network? 2. Where should I close stores—and how can I do it without losing customers? 3. Where should I open new stores to get the best ROI? It predicts future sales potential for any location using data-driven simulations. You can compare multiple sites based on market potential, competition, internal cannibalization, and omnichannel impact. The platform is structured around three steps: -Explore: Integrates your internal data with smart market data (mobility, demographics, competition, etc.) -Predict: Uses accurate predictive models to estimate customer behavior and sales potential per location. -Optimize: Tests different what-if scenarios to guide actions like openings, closings, marketing, and investment decisions.

Who Is the Company Behind RetailSonar?

Safestreets

SafeStreets scores how walkable any address is, from 0 to 10, built entirely on open public data rather than a proprietary index you cannot inspect. Every score breaks into four parts: daily-needs access, street safety, transit reach, and comfort, with neighborhood-level detail across 190+ countries. Real estate platforms, developers, planners, and researchers use it to score listing inventory, screen sites, and compare neighborhoods. The model includes pedestrian safety and transit reliability that most walk-score tools leave out, and the full methodology is published so every number is auditable. The address-level tool is free to use. A downloadable US neighborhood dataset and a scoring data layer are available for teams that need coverage at scale.

Who Is the Company Behind Safestreets?

Settilo

Who Is the Company Behind Settilo?

SiteGaps

SiteGaps ~ Location intelligence for site decisions SiteGaps brings demographics, demand, and competitor coverage onto a single map, and packages the lot into a clean, sharable analysis report. Built to answer one question end-to-end: where should I open next, and what does the catchment look like? Define the catchment any way you draw it Drive-time isochrones with traffic-aware profiles, radius circles, ABS SAL suburb boundaries, or hand-drawn polygons for irregular shapes. Every catchment shape feeds the same demographic and supply pipeline, so the rest of the report stays consistent regardless of how you frame the area. Granular census data analysis Population, age structure, income bands, household composition, dwelling mix, education, employment, and more — apportioned into your catchment and reconciled to the headline total. The platform delivers 20+ data tables across 6 demographic sections, with state benchmark and 2021 census comparison columns built in. Population growth projections run through 2032 so you can size catchments for the medium term, not just today. Map the competitors that matter Tenant-grouped venue lists span small, medium, and large format retail, gyms and wellness, petrol stations, food and beverage, and any custom POI categories added on request. Filter to your full supply radius or just the trade area, with counts inside primary and secondary catchments making competitive density immediate. Over 100 named tenants are tracked with canonical labels, and live competitor markers sit directly on the map. One report. Every section. Compared side-by-side. The full demographic and market analysis renders as a single read-mode report, with text or chart views available per table. Save catchment snapshots to a comparison report and stack two or more locations against each other in a side-by-side matrix view — the workflow site selection teams actually need when they're choosing between candidates. Built for site selection teams Property developers, franchisors, network planners, QSR operators, childcare providers, retail chains, fitness brands, fuel and convenience networks, and urban planners. Sign up and start evaluating sites the same day. No GIS engineer required, no procurement cycle, no implementation fee. Why teams choose SiteGaps Self-serve free trial, live in minutes Transparent pricing with monthly billing ABS census-grade data reconciled to headline totals Continuously expanding competitor coverage, new tenants added on request Comparison reports that stack catchments side-by-side

Who Is the Company Behind SiteGaps?

Skyhook Geospatial Insights

Skyhook is a global location network with more than 4.5 billion Wi-Fi access points and millions of venues. The massive amount of data collected powers all of our products, providing the best location for any app or device - and delivering it with unmatched context.

Who Is the Company Behind Skyhook Geospatial Insights?

Social Explorer

Social Explorer's demographic mapping software is used by educational institutions, government agencies, non-profits, and for-profit companies in the marketing, real estate, and utilities industries to understand their communities. Build maps and reports using over 500,000 variables from built-in crime, environmental, health, and social datasets in order to profile the neighborhoods, census blocks, zip codes, counties, or states that matter most to your organization. All of this is available via Social Explorer's user-friendly interface, making it the perfect tool for users who need location intelligence but don't have extensive GIS training.

Who Is the Company Behind Social Explorer?

Spexi

The First Decentralized Aerial Imagery Network—Built for Real-Time Insight Spexi is the first company in the world to create a decentralized, automated drone imagery network—delivering high-resolution aerial data faster, cleaner, and more affordably than any traditional method. Built on the open LayerDrone protocol, Spexi is changing how governments and businesses see and understand the world from above. Unlike satellites or fixed-wing aircraft, which are slow, expensive, and limited in resolution, Spexi captures imagery that’s 900× more detailed, 200× faster, and 50× more affordable—all with 97% fewer emissions. Data is captured by local, qualified drone pilots using fully automated flight plans across standardized zones called Spexigons. The result is consistent, ultra-accurate imagery delivered in hours—not weeks or months. Spexi’s decentralized model makes it the first truly scalable system for on-demand aerial data. It’s not just a better alternative—it’s a fundamentally different way of collecting Earth intelligence. From infrastructure and urban planning to disaster response, inspections, and environmental monitoring, Spexi empowers decision-makers with fresh, verified, and standardized imagery whenever it’s needed. And with flexible per-area pricing, you only pay for the coverage you require—whether it’s a single site or a full city scan. Spexi isn’t just a product—it’s a new infrastructure layer for the physical world. For the first time, real-time, high-resolution geospatial data is accessible, affordable, and built to scale.

Who Is the Company Behind Spexi?

Bijou Barry
BB
Researched and written by Bijou Barry
Updated October 3, 2024