Best JavaScript Web Frameworks - Page 2

How Many JavaScript Web Frameworks Products Does G2 Track?

Total Products under this Category: 97

Category Stats (Sep 2026)

  • Average Rating: 4.35/5 (↑0.01 vs Aug 2026) The average rating of products in this category, based on all submitted ratings
  • Top Trending Product: Node.js (+0.04%) - Among all products in this category, Node.js recorded the largest rating increase compared to last month

Last updated: September 11, 2026

How Does G2 Rank JavaScript Web Frameworks Products?

Why You Can Trust G2's Software Rankings:

  • 30 Analysts and Data Experts
  • 2,800+ Authentic Reviews
  • 97+ Products
  • Unbiased Rankings

G2's software rankings are built on verified user reviews, rigorous moderation, and a consistent research methodology maintained by a team of analysts and data experts. Each product is measured using the same transparent criteria, with no paid placement or vendor influence. While reviews reflect real user experiences, which can be subjective, they offer valuable insight into how software performs in the hands of professionals. Together, these inputs power the G2 Score, a standardized way to compare tools within every category.

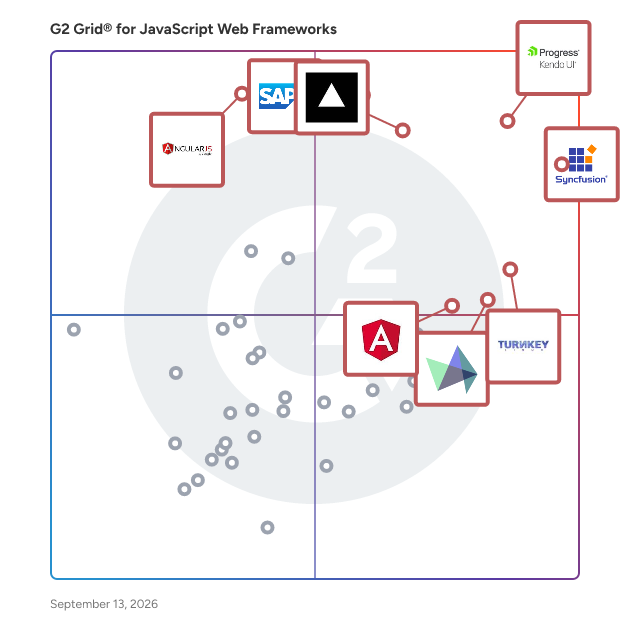
G2 Grid® for JavaScript Web Frameworks

G2 Grid® for JavaScript Web Frameworks plotting products by satisfaction and market presence

Highlighted products: Essential Studio, Progress Kendo UI, Next.js, SAPUI5, Node.js, Highcharts, angularjs, and Angular.

Underlying data: [Grid® JSON](https://www.g2.com/categories/javascript-web-frameworks/grids.json?focus%5B%5D=essential-studio&focus%5B%5D=progress-kendo-ui&focus%5B%5D=next-js&focus%5B%5D=sapui5&focus%5B%5D=node-js&focus%5B%5D=highcharts&focus%5B%5D=angularjs&focus%5B%5D=angular)

GraphicsJS JavaScript Graphics

GraphicsJS is a lightweight, open-source JavaScript graphics library designed for creating interactive and animated graphics with ease. Built upon SVG/VML technology, it offers an intuitive API that simplifies the development of complex visualizations, making it suitable for data visualization, charting, game design, and more. Key Features and Functionality: - Rich Line Drawing: Supports not only Bézier curves but also various deformations, including arcs and other complex curves. - Advanced Text Features: Enables multiline text, text measurement (width, height), wrapping, overflow handling, indentation, spacing, and alignment. - Virtual DOM: Provides an abstraction of the HTML DOM, ensuring efficient rendering performance. - Smart Layering System: Includes z-index support, allowing dynamic arrangement of overlapping elements without redrawing the entire scene. - Transformation Engine: Offers a convenient API for moving, scaling, rotating, and shearing elements or groups of elements. - Cross-Browser Compatibility: Supports legacy browsers, including Internet Explorer 6+, ensuring broad accessibility. - Intuitive API: Features a concise, chainable API that reduces code complexity and enhances developer productivity. Primary Value and User Solutions: GraphicsJS empowers developers to create intricate and interactive graphics effortlessly, addressing the need for a robust and flexible graphics library. Its comprehensive feature set and cross-browser support make it an ideal choice for projects requiring dynamic visual content, from data-driven charts to animated graphics, ensuring a seamless user experience across various platforms.

Average Rating: 3.9/5.0

Total Reviews: 15

How Do G2 Users Rate GraphicsJS JavaScript Graphics?

  • Libraries: 9.0/10 (Category avg: 8.8/10)
  • Has the product been a good partner in doing business?: 9.2/10 (Category avg: 8.6/10)
  • Widgets: 8.0/10 (Category avg: 8.3/10)
  • Browser Support: 8.8/10 (Category avg: 9.1/10)

Who Is the Company Behind GraphicsJS JavaScript Graphics?

  • Seller: AnyChart
  • Year Founded: 2003
  • HQ Location: Saint Augustine, FL
  • Twitter: @AnyChart
    6,364 Twitter followers
  • LinkedIn® Page: www.linkedin.com
    14 employees on LinkedIn®
  • Phone: 1(888) 845-1211

Who Uses This Product?

  • Company Size: 53% Small, 29% Large

What Do G2 Reviewers Say About GraphicsJS JavaScript Graphics?

AI-generated summary from verified user reviews

Pros
  • Users praise the high product quality of GraphicsJS, noting that explanations are clear and comprehensive.
  • Users value the clean and clear explanation provided by GraphicsJS, ensuring all important tasks are well covered.

What Are Recent G2 Reviews of GraphicsJS JavaScript Graphics?

What Are G2 Users Discussing About GraphicsJS JavaScript Graphics?

Moment.js

Moment.sj is software that parses, validates, manipulates, and displays dates and times in JavaScript.

Average Rating: 4.5/5.0

Total Reviews: 25

How Do G2 Users Rate Moment.js?

  • Libraries: 8.8/10 (Category avg: 8.8/10)
  • Has the product been a good partner in doing business?: 8.9/10 (Category avg: 8.6/10)
  • Widgets: 7.1/10 (Category avg: 8.3/10)
  • Browser Support: 8.8/10 (Category avg: 9.1/10)

Who Is the Company Behind Moment.js?

  • Seller: Moment.js
  • HQ Location: N/A
  • Twitter: @momentjs
    2,365 Twitter followers
  • LinkedIn® Page: www.linkedin.com
    1 employees on LinkedIn®

Who Uses This Product?

  • Top Industries: Computer Software
  • Company Size: 54% Small, 23% Large

What Are Recent G2 Reviews of Moment.js?

What Are G2 Users Discussing About Moment.js?

Ag Grid

ag-Grid is a JavaScript data grid designed for Enterprise Applications. It delivers a large feature set combined with Enterprise grade performance.

Average Rating: 4.6/5.0

Total Reviews: 10

How Do G2 Users Rate Ag Grid?

  • Libraries: 9.0/10 (Category avg: 8.8/10)
  • Has the product been a good partner in doing business?: 8.9/10 (Category avg: 8.6/10)
  • Widgets: 7.2/10 (Category avg: 8.3/10)
  • Browser Support: 9.0/10 (Category avg: 9.1/10)

Who Is the Company Behind Ag Grid?

  • Seller: ag-Grid
  • Year Founded: 2015
  • HQ Location: London, England
  • Twitter: @ag_grid
    3,136 Twitter followers
  • LinkedIn® Page: www.linkedin.com
    84 employees on LinkedIn®

Who Uses This Product?

  • Company Size: 50% Large, 40% Medium

What Do G2 Reviewers Say About Ag Grid?

AI-generated summary from verified user reviews

Pros
  • Users appreciate the smooth data handling of Ag Grid, enhancing their experience with real-time data display.
  • Users value the flexibility and robust features of Ag Grid, enhancing overall user experience.
  • Users enjoy the effective chart visualization in Ag Grid, enhancing the display of real-time data insights.
  • Users appreciate the flexibility of Ag Grid, enhancing their ability to customize data presentation effectively.
  • Users appreciate the great user interface of Ag Grid, enjoying a seamless and intuitive experience.
Cons
  • Users find the steep learning curve challenging, with suggestions for improvement to enhance usability.
  • Users find that documentation issues sometimes leave them without all the answers they need for Ag Grid.
  • Users find that the poor documentation often leaves them without the necessary answers for effective use of Ag Grid.
  • Users report that upgrading issues with Ag Grid can lead to significant problems in their existing implementations.

What Are Recent G2 Reviews of Ag Grid?

What Are G2 Users Discussing About Ag Grid?

ember.js

A framework for creating ambitious web applications.

Average Rating: 4.4/5.0

Total Reviews: 15

How Do G2 Users Rate ember.js?

  • Has the product been a good partner in doing business?: 8.8/10 (Category avg: 8.6/10)

Who Is the Company Behind ember.js?

  • Seller: Tilde
  • Year Founded: 2011
  • HQ Location: Portland, Oregon
  • LinkedIn® Page: www.linkedin.com
    8 employees on LinkedIn®

Who Uses This Product?

  • Top Industries: Computer Software
  • Company Size: 72% Small, 22% Medium

What Are Recent G2 Reviews of ember.js?

Backbone.js

Backbone.js gives structure to web applications by providing models with key-value binding and custom events, collections with a rich API of enumerable functions, views with declarative event handling, and connects it all to your existing API over a RESTful JSON interface.

Average Rating: 4.0/5.0

Total Reviews: 35

How Do G2 Users Rate Backbone.js?

  • Libraries: 8.3/10 (Category avg: 8.8/10)
  • Has the product been a good partner in doing business?: 8.1/10 (Category avg: 8.6/10)
  • Widgets: 8.6/10 (Category avg: 8.3/10)
  • Browser Support: 8.1/10 (Category avg: 9.1/10)

Who Is the Company Behind Backbone.js?

  • Seller: DocumentCloud
  • Year Founded: 2009
  • HQ Location: Columbia, MO
  • Twitter: @documentcloud
    5,303 Twitter followers
  • LinkedIn® Page: www.linkedin.com
    1 employees on LinkedIn®

Who Uses This Product?

  • Who Uses This: Software Engineer
  • Top Industries: Computer Software, Information Technology and Services
  • Company Size: 41% Small, 32% Large

What Are Recent G2 Reviews of Backbone.js?

What Are G2 Users Discussing About Backbone.js?

EJS

EJS is a simple templating language that lets you generate HTML markup with plain JavaScript.

Average Rating: 4.2/5.0

Total Reviews: 19

How Do G2 Users Rate EJS?

  • Libraries: 7.4/10 (Category avg: 8.8/10)
  • Has the product been a good partner in doing business?: 7.2/10 (Category avg: 8.6/10)
  • Widgets: 7.5/10 (Category avg: 8.3/10)
  • Browser Support: 8.2/10 (Category avg: 9.1/10)

Who Is the Company Behind EJS?

  • Seller: Bitovi
  • Year Founded: 2005
  • HQ Location: Libertyville, IL
  • Twitter: @bitovi
    1,885 Twitter followers
  • LinkedIn® Page: www.linkedin.com
    87 employees on LinkedIn®

Who Uses This Product?

  • Top Industries: Computer Software
  • Company Size: 82% Small, 18% Medium

What Are Recent G2 Reviews of EJS?

What Are G2 Users Discussing About EJS?

Webix

Webix offers a complete ecosystem of tools tailored for enterprise-grade applications. At its core is the Webix DataTable—a blazing-fast grid for handling massive datasets with features like live updates, virtual scrolling, advanced filtering, editing, and data export. Developers working with hierarchical structures can leverage TreeTable, while Charts, Forms, Calendars, and Toolbars round out the essential UI building blocks. Need complex functionality out of the box? Webix delivers production-ready widgets like: - Gantt – plan, schedule, and track tasks across timelines - Scheduler – manage appointments with multi-view calendars - Kanban – visualize workflows with drag-and-drop task cards - File & Doc Manager – browse, upload, and edit documents inside your app - Spreadsheet – Excel-like interface with formulas and styles - Pivot – slice and dice big data with ease - Query Builder, User Manager, RichText, To Do, and more For maximum flexibility, all Webix components are: - Fully customizable with CSS and JS APIs - Compatible with TypeScript - Cross-browser and mobile-ready - Localized and accessible - Exportable to PDF, Excel, PNG - Integratable with REST, GraphQL, and backend platforms Whether you’re a solo developer or a team building mission-critical systems, Webix helps you move faster, reduce bugs, and deliver polished user experiences — without reinventing the wheel. 👉 Learn more at https://webix.com

Average Rating: 4.5/5.0

Total Reviews: 17

How Do G2 Users Rate Webix?

  • Libraries: 8.3/10 (Category avg: 8.8/10)
  • Has the product been a good partner in doing business?: 8.7/10 (Category avg: 8.6/10)
  • Widgets: 10.0/10 (Category avg: 8.3/10)
  • Browser Support: 10.0/10 (Category avg: 9.1/10)

Who Is the Company Behind Webix?

  • Seller: XB Software
  • Year Founded: 2008
  • HQ Location: Warsaw, Poland
  • Twitter: @xbsoftware
    305 Twitter followers
  • LinkedIn® Page: www.linkedin.com
    141 employees on LinkedIn®

Who Uses This Product?

  • Company Size: 71% Small, 24% Medium

What Do G2 Reviewers Say About Webix?

AI-generated summary from verified user reviews

Pros
  • Users find Webix to be affordable, delivering great value with powerful features and excellent support throughout development.
  • Users commend Webix for its responsive customer support, ensuring timely and helpful assistance throughout their experience.
  • Users praise the high product quality of Webix, noting its impressive UI components and responsive support.
  • Users commend the intuitive user interface of Webix, which enhances development efficiency and accelerates project timelines.
  • Users praise Webix for its rich UI components that enhance frontend development efficiency and flexibility.
Cons
  • Users find that Webix lacks built-in responsive design support, leading to manual adjustments for optimal layouts.

What Are Recent G2 Reviews of Webix?

What Are G2 Users Discussing About Webix?

higlight.js

higlight.js is a scripting language, syntax in JavaScript for the web.

Average Rating: 4.3/5.0

Total Reviews: 14

How Do G2 Users Rate higlight.js?

  • Libraries: 9.0/10 (Category avg: 8.8/10)
  • Has the product been a good partner in doing business?: 8.3/10 (Category avg: 8.6/10)
  • Widgets: 8.7/10 (Category avg: 8.3/10)
  • Browser Support: 9.7/10 (Category avg: 9.1/10)

Who Is the Company Behind higlight.js?

  • Seller: higlight.js
  • HQ Location: N/A
  • Twitter: @highlightjs
    583 Twitter followers
  • LinkedIn® Page: www.linkedin.com
    1 employees on LinkedIn®

Who Uses This Product?

  • Top Industries: Computer Software
  • Company Size: 47% Small, 33% Large

What Are Recent G2 Reviews of higlight.js?

Nestjs

NestJS is a progressive Node.js framework designed for building efficient, scalable, and maintainable server-side applications. Leveraging TypeScript, it combines elements of object-oriented programming, functional programming, and reactive programming to provide a robust development experience. Key Features and Functionality: - Modular Architecture: Encourages the division of applications into self-contained modules, enhancing code organization, reusability, and scalability. - TypeScript Support: Built with TypeScript, offering static typing and modern JavaScript features, which improve code reliability and maintainability. - Dependency Injection: Incorporates a powerful dependency injection system, promoting loose coupling and enhancing testability. - Decorator-Based Syntax: Utilizes decorators to define routes, middleware, and other components, resulting in cleaner and more readable code. - Platform Agnosticism: Supports various transport layers, including HTTP, WebSockets, and microservices, allowing developers to build diverse types of applications. - Integrated Testing Tools: Provides built-in support for unit and integration testing, facilitating the maintenance of high code quality. Primary Value and Problem Solved: NestJS addresses the challenges of building complex and scalable server-side applications by offering a structured and modular architecture. Its TypeScript foundation ensures type safety, reducing runtime errors and enhancing developer productivity. The framework's support for various communication protocols and its extensible nature make it suitable for a wide range of applications, from RESTful APIs to real-time services and microservices architectures. By providing a comprehensive set of tools and features out of the box, NestJS enables developers to focus on implementing business logic rather than configuring infrastructure, thereby accelerating development cycles and improving maintainability.

Average Rating: 4.5/5.0

Total Reviews: 21

How Do G2 Users Rate Nestjs?

  • Libraries: 9.3/10 (Category avg: 8.8/10)
  • Has the product been a good partner in doing business?: 9.2/10 (Category avg: 8.6/10)
  • Widgets: 8.6/10 (Category avg: 8.3/10)
  • Browser Support: 9.2/10 (Category avg: 9.1/10)

Who Is the Company Behind Nestjs?

  • Seller: Hossted
  • Year Founded: 2006
  • HQ Location: Bnei Brak, Israel
  • LinkedIn® Page: www.linkedin.com
    55 employees on LinkedIn®

Who Uses This Product?

  • Top Industries: Computer Software
  • Company Size: 43% Medium, 33% Small

What Are Recent G2 Reviews of Nestjs?

What Are G2 Users Discussing About Nestjs?

CanvasJS Charts

CanvasJS Charts is an HTML5 Charting library that runs across devices and browsers and has 10x Performance Compared to traditional SVG charting Libraries. This allows you to create rich dashboards that work across devices without compromising on maintainability or functionality of your web application.

Average Rating: 4.6/5.0

Total Reviews: 18

How Do G2 Users Rate CanvasJS Charts?

  • Libraries: 10.0/10 (Category avg: 8.8/10)
  • Has the product been a good partner in doing business?: 10.0/10 (Category avg: 8.6/10)
  • Widgets: 8.3/10 (Category avg: 8.3/10)
  • Browser Support: 8.3/10 (Category avg: 9.1/10)

Who Is the Company Behind CanvasJS Charts?

Who Uses This Product?

  • Company Size: 61% Small, 22% Medium

What Are Recent G2 Reviews of CanvasJS Charts?

What Are G2 Users Discussing About CanvasJS Charts?

Gulpjs

Gulpjs is a streaming build system.

Average Rating: 4.1/5.0

Total Reviews: 18

How Do G2 Users Rate Gulpjs?

  • Libraries: 8.3/10 (Category avg: 8.8/10)
  • Has the product been a good partner in doing business?: 8.3/10 (Category avg: 8.6/10)
  • Widgets: 8.1/10 (Category avg: 8.3/10)
  • Browser Support: 8.8/10 (Category avg: 9.1/10)

Who Is the Company Behind Gulpjs?

  • Seller: gulp
  • HQ Location: N/A
  • Twitter: @gulpjs
    37,049 Twitter followers
  • LinkedIn® Page: www.linkedin.com
    1 employees on LinkedIn®

Who Uses This Product?

  • Top Industries: Computer Software
  • Company Size: 61% Small, 39% Medium

What Are Recent G2 Reviews of Gulpjs?

What Are G2 Users Discussing About Gulpjs?

RequireJS

RequireJS is a JavaScript file and module loader.

Average Rating: 4.1/5.0

Total Reviews: 12

How Do G2 Users Rate RequireJS?

  • Libraries: 8.9/10 (Category avg: 8.8/10)
  • Has the product been a good partner in doing business?: 8.3/10 (Category avg: 8.6/10)
  • Widgets: 7.9/10 (Category avg: 8.3/10)
  • Browser Support: 9.6/10 (Category avg: 9.1/10)

Who Is the Company Behind RequireJS?

  • Seller: RequireJS
  • HQ Location: N/A
  • Twitter: @requirejs
    152 Twitter followers
  • LinkedIn® Page: www.linkedin.com
    1 employees on LinkedIn®

Who Uses This Product?

  • Company Size: 38% Small, 38% Medium

What Are Recent G2 Reviews of RequireJS?

Sails.js

Sails makes it easy to build custom, enterprise-grade Node.js apps.

Average Rating: 4.4/5.0

Total Reviews: 16

How Do G2 Users Rate Sails.js?

  • Libraries: 8.8/10 (Category avg: 8.8/10)
  • Has the product been a good partner in doing business?: 7.9/10 (Category avg: 8.6/10)
  • Widgets: 9.2/10 (Category avg: 8.3/10)
  • Browser Support: 9.4/10 (Category avg: 9.1/10)

Who Is the Company Behind Sails.js?

  • Seller: Sails.js
  • Year Founded: 2014
  • HQ Location: Austin, TX
  • LinkedIn® Page: www.linkedin.com
    3 employees on LinkedIn®

Who Uses This Product?

  • Who Uses This: Senior Software Engineer
  • Top Industries: Computer Software
  • Company Size: 56% Small, 39% Medium

What Are Recent G2 Reviews of Sails.js?

What Are G2 Users Discussing About Sails.js?

D3.js

D3 (or D3.js) is a free, open-source JavaScript library for visualizing data. Its low-level approach built on web standards offers unparalleled flexibility in authoring dynamic, data-driven graphics. For more than a decade D3 has powered groundbreaking and award-winning visualizations, become a foundational building block of higher-level chart libraries, and fostered a vibrant community of data practitioners around the world. D3 “slingshotted the field into growth, diversification and creativity that has been unprecedented” and “changed how millions of data visualizations are created across newsrooms, websites, and personal portfolios,” remarked the Information is Beautiful 2022 Test of Time Award. The IEEE VIS 2021 Test of Time Award noted, “By creating a framework that was compelling and easy for web developers to use to author interactive visualizations, the authors have undeniably helped to bring data visualization to the mainstream. [D3] is a cornerstone contribution to this conference specifically and more generally to the success of our field as a whole.” D3 was created by Mike Bostock in 2011. Mike co-authored the D3 paper with Jeff Heer and Vadim Ogievetsky at Stanford. Jason Davies made major contributions to D3 from 2011 to 2013, most notably to D3’s geographic projection system. Philippe Rivière has been a major contributor to D3 and its documentation since 2016. Over the years, countless kind individuals have contributed to D3 by sharing code and ideas, by teaching and answering questions, and by bringing people together to further the practice of visualization. Mike and Philippe now maintain D3 and Observable Plot at Observable.

Average Rating: 4.2/5.0

Total Reviews: 17

How Do G2 Users Rate D3.js?

  • Libraries: 7.4/10 (Category avg: 8.8/10)
  • Has the product been a good partner in doing business?: 8.3/10 (Category avg: 8.6/10)
  • Widgets: 7.2/10 (Category avg: 8.3/10)
  • Browser Support: 7.8/10 (Category avg: 9.1/10)

Who Is the Company Behind D3.js?

  • Seller: Observable
  • Year Founded: 2017
  • HQ Location: San Francisco, US
  • Twitter: @observablehq
    25,314 Twitter followers
  • LinkedIn® Page: www.linkedin.com
    23 employees on LinkedIn®

Who Uses This Product?

  • Company Size: 63% Medium, 42% Small

What Are Recent G2 Reviews of D3.js?

AnyChart JS Charts

AnyChart is an award-winning JavaScript charting library from the world's leader in data visualization, which makes it easy for developers to add beautiful interactive charts and dashboards to any web, mobile, or standalone project. AnyChart is flexible, lightweight, cross-platform and cross-browser, with outstanding documentation and API reference. Provides over 70 built-in chart types and numerous features out of the box. Runs on any platform and with any database. Prompt support guaranteed. More than 75% of Fortune 500 companies across all industries and over half of the top 1,000 software vendors worldwide use AnyChart to operate data visualization in their business intelligence, reporting and analytics systems. Join the leaders!

Average Rating: 4.3/5.0

Total Reviews: 12

How Do G2 Users Rate AnyChart JS Charts?

  • Libraries: 8.3/10 (Category avg: 8.8/10)
  • Has the product been a good partner in doing business?: 10.0/10 (Category avg: 8.6/10)
  • Widgets: 8.0/10 (Category avg: 8.3/10)
  • Browser Support: 9.6/10 (Category avg: 9.1/10)

Who Is the Company Behind AnyChart JS Charts?

  • Seller: AnyChart
  • Year Founded: 2003
  • HQ Location: Saint Augustine, FL
  • Twitter: @AnyChart
    6,364 Twitter followers
  • LinkedIn® Page: www.linkedin.com
    14 employees on LinkedIn®
  • Phone: 1(888) 845-1211

Who Uses This Product?

  • Top Industries: Computer Software
  • Company Size: 43% Small, 29% Large

What Are Recent G2 Reviews of AnyChart JS Charts?

What Are G2 Users Discussing About AnyChart JS Charts?

Adam Crivello
AC
Researched and written by Adam Crivello
Updated October 3, 2024