Best Embedded Business Intelligence Software - Page 8

How Many Embedded Business Intelligence Software Products Does G2 Track?

Total Products under this Category: 175

Category Stats (Sep 2026)

  • Average Rating: 4.44/5 (↑0.01 vs Aug 2026) The average rating of products in this category, based on all submitted ratings
  • Top Trending Product: ClicData (+1.36%) - Among all products in this category, ClicData recorded the largest rating increase compared to last month

Last updated: September 01, 2026

How Does G2 Rank Embedded Business Intelligence Software Products?

Why You Can Trust G2's Software Rankings:

  • 30 Analysts and Data Experts
  • 18,200+ Authentic Reviews
  • 175+ Products
  • Unbiased Rankings

G2's software rankings are built on verified user reviews, rigorous moderation, and a consistent research methodology maintained by a team of analysts and data experts. Each product is measured using the same transparent criteria, with no paid placement or vendor influence. While reviews reflect real user experiences, which can be subjective, they offer valuable insight into how software performs in the hands of professionals. Together, these inputs power the G2 Score, a standardized way to compare tools within every category.

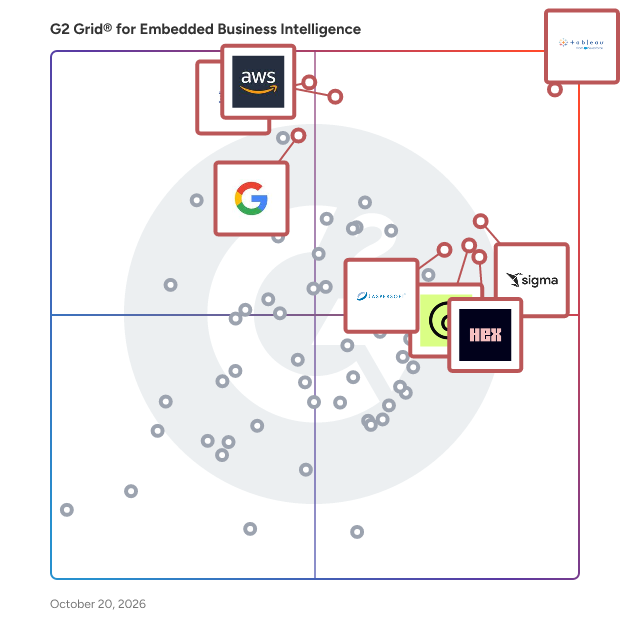
G2 Grid® for Embedded Business Intelligence Software

G2 Grid® for Embedded Business Intelligence Software plotting products by satisfaction and market presence

Highlighted products: Tableau, Amazon Quick, GoodData.AI, IBM Cognos Analytics, Hex, Sigma, Jaspersoft, and Domo.

Underlying data: [Grid® JSON](https://www.g2.com/categories/embedded-business-intelligence/grids.json?focus%5B%5D=tableau&focus%5B%5D=amazon-quick&focus%5B%5D=gooddata-ai&focus%5B%5D=ibm-cognos-analytics&focus%5B%5D=hex-tech-hex&focus%5B%5D=sigma-computing-sigma&focus%5B%5D=jaspersoft&focus%5B%5D=domo)

PopSQL

PopSQL is the evolution of legacy SQL editors like DataGrip, DBeaver, Postico. We provide a beautiful, modern SQL editor for data focused teams looking to save time, improve data accuracy, onboard new hires faster, and deliver insights to the business fast. With PopSQL, users can easily understand their data model, write version controlled SQL, collaborate with live presence, visualize data in charts and dashboards, schedule reports, share results, and organize foundational queries for search and discovery. Even if your team is already leveraging a large BI tool, like Tableau or Looker, or a hodge podge of SQL editors, PopSQL enables seamless collaboration between your SQL power users, junior analysts, and even your less technical stakeholders who are hungry for data insights. * Cross-platform compatibility with macOS, Windows, and Linux * Works with Snowflake, Redshift, BigQuery, Clickhouse, Databricks, Athena, MongoDB, PostgreSQL, MySQL, SQL Server, SQLite, Presto, Cassandra, and more

Average Rating: 4.6/5.0

Total Reviews: 80

How Do G2 Users Rate PopSQL?

  • Has the product been a good partner in doing business?: 9.6/10 (Category avg: 8.9/10)
  • Steps to Answer: 8.6/10 (Category avg: 8.3/10)
  • Reports Interface: 8.5/10 (Category avg: 8.8/10)
  • Calculated Fields: 8.3/10 (Category avg: 8.5/10)

Who Is the Company Behind PopSQL?

Who Uses This Product?

  • Top Industries: Computer Software, Information Technology and Services
  • Company Size: 43% Small, 37% Medium

What Are Recent G2 Reviews of PopSQL?

What Are G2 Users Discussing About PopSQL?

PowerBI Portal

PowerBI Portal is a web-based solution that helps organizations securely share and embed live Power BI reports and dashboards with internal and external users, without requiring a Power BI license for every viewer. It is designed to simplify report distribution, reduce licensing complexity, and make business insights accessible through a centralized, scalable portal experience. Built for companies that need to extend Power BI beyond their internal analyst teams, PowerBI Portal allows businesses to host interactive reports in branded web portals, websites, and apps while maintaining controlled access to data. Its positioning on the PowerBI Tiles site emphasizes unlimited sharing, secure delivery, and easier collaboration for organizations that want broader access to insights without the usual friction and cost of traditional Power BI sharing models. PowerBI Portal is part of the PowerBI Tiles Suite and is supported by ongoing product evolution, including updates such as SSO-related enhancements and new management capabilities. Overall, it is built for organizations that want a more flexible, scalable, and business-friendly way to deliver Power BI content to anyone, anytime.

Average Rating: 4.5/5.0

Total Reviews: 1

Who Is the Company Behind PowerBI Portal?

Who Uses This Product?

  • Company Size: 50% Large

What Are Recent G2 Reviews of PowerBI Portal?

Rocket AS

Rocket® AS software enables you to quickly access the data you need, analyze and interpret data to gain insight into your business, and present that insight in a way that’s aesthetically appealing, streamlined and simple. Plus, AS allows you to build these capabilities into your own line of business applications, and integrate with other systems or applications.

Average Rating: 4.5/5.0

Total Reviews: 1

How Do G2 Users Rate Rocket AS?

  • Steps to Answer: 8.3/10 (Category avg: 8.3/10)
  • Reports Interface: 10.0/10 (Category avg: 8.8/10)
  • Calculated Fields: 10.0/10 (Category avg: 8.5/10)

Who Is the Company Behind Rocket AS?

  • Seller: Rocket Software
  • Year Founded: 1990
  • HQ Location: Waltham, MA
  • Twitter: @Rocket
    3,532 Twitter followers
  • LinkedIn® Page: www.linkedin.com
    4,347 employees on LinkedIn®

Who Uses This Product?

  • Company Size: 100% Medium

What Are Recent G2 Reviews of Rocket AS?

SplashBI

SplashBI helps organizations make the very best business decisions by providing instant access to data from disparate systems in the form of reports, visualizations, & trends. The SplashBI solution is available in the cloud or on-premise and easily accessible via mobile devices. From HR People Analytics to Finance, Month End & Year End Reporting, to Sales & Marketing Trends / Dashboards, and much more, SplashBI offers insightful pre-built content, powerful ad-hoc reporting, and in-depth dashboards, for immediate ROI. Finally, SplashBI’s data models allow for fast-track-low-cost implementations. Blend, report, visualize, and analyze ALL your data in a single platform, SplashBI. Let your data help drive your business.

Average Rating: 4.5/5.0

Total Reviews: 4

How Do G2 Users Rate SplashBI?

  • Steps to Answer: 9.2/10 (Category avg: 8.3/10)
  • Reports Interface: 7.5/10 (Category avg: 8.8/10)
  • Calculated Fields: 6.7/10 (Category avg: 8.5/10)

Who Is the Company Behind SplashBI?

  • Seller: SplashBI
  • Year Founded: 2014
  • HQ Location: Duluth, US
  • Twitter: @SplashBI
    4,010 Twitter followers
  • LinkedIn® Page: www.linkedin.com
    375 employees on LinkedIn®

Who Uses This Product?

  • Company Size: 50% Large, 50% Small

What Are Recent G2 Reviews of SplashBI?

What Are G2 Users Discussing About SplashBI?

Teechart

TeeChart is a charting library for programmers.

Average Rating: 3.5/5.0

Total Reviews: 1

How Do G2 Users Rate Teechart?

  • Reports Interface: 6.7/10 (Category avg: 8.8/10)
  • Calculated Fields: 6.7/10 (Category avg: 8.5/10)

Who Is the Company Behind Teechart?

  • Seller: Steema Software
  • Year Founded: 1996
  • HQ Location: Girona, ES
  • Twitter: @SteemaSoftware
    864 Twitter followers
  • LinkedIn® Page: www.linkedin.com
    6 employees on LinkedIn®

Who Uses This Product?

  • Company Size: 100% Large

What Are G2 Users Discussing About Teechart?

ACTIVE Hub

Who Is the Company Behind ACTIVE Hub?

  • Seller: Global Payments
  • Year Founded: 1967
  • HQ Location: Atlanta, US
  • Twitter: @GlobalPayInc
    6,042 Twitter followers
  • LinkedIn® Page: www.linkedin.com
    25,141 employees on LinkedIn®
  • Ownership: NYSE:GPN

AI analytics engine

We work with your existing data environment, define key metrics, and let our AI analytics engine generate explainable reports with ready-to-use insights. We offer a governed AI reporting layer added on top of your existing data model. It translates defined business metrics into validated, traceable outputs – so teams can request and adjust reports in plain language without writing SQL or waiting on ad-hoc queries. One engine – two deployment paths: 1. Embed it into your product Add governed AI reporting directly into your SaaS or platform. Keep your UI, your workflows, your database. 2. Run it as a standalone solution Deploy it as an independent reporting layer that connects to your data sources and delivers validated outputs.

Who Is the Company Behind AI analytics engine?

AIQoD

AIQoD is a No-code Intelligent Information Management for enterprises with enhanced AI & machine learning capabilities. We are pioneers in Information Digitization Technology and a SaaS-based platform that can automate any business process and related documents using technologies such as Image, Text & Video Analysis, Pattern Recognition, Automation using Web & Windows Recorder, Automation over Citrix Environment and powered with OCR, NLP, AI & Machine Learning.

Who Is the Company Behind AIQoD?

  • Seller: AIQoD
  • Year Founded: 2015
  • HQ Location: Pune, IN
  • LinkedIn® Page: www.linkedin.com
    63 employees on LinkedIn®

AnswerDock

AnswerDock is an AI-driven analytics solution that uses Natural Language Processing to provide answers to business users' questions, allowing them to make better and faster data-driven decisions, without the need for data analysts. You can try the product free by signing up. You will be able to upload your own data and experience most of the features of AnswerDock in the free version. Using AnswerDock, business users create their own reports and dashboards by typing their questions, just like using a web search engine. For example, users can type Top 10 Sales People by growth in number of leads this quarter. AnswerDock runs the analysis and displays the optimal visualization instantly. AnswerDock runs powerful data mining algorithms to answer questions asked in natural language, such as: • What drives my conversion rate up? • Why did Sales increase yesterday? • Whats driving shipment status to be delayed? • How does PageViews affect Revenue? AnswerDock connects to a variety of sources from excel files to relational databases (Mysql, SQL Server, … ) to 3rd-party APIs such as Google Analytics .Users can create dashboards combining multiple sources, enabling them to have an integrated view on their business. Industry professionals from any business function can use AnswerDock to easily explore their company's data, using an intuitive search-like interface with no required training. AnswerDock supports professionals in Retail and Ecommerce, Finance and Insurance, Healthcare, Transportation and Logistics, Communications and Media, Manufacturing, among other industries. AnswerDock provides a comprehensive data platform with tons of features: • Natural Language Processing • Auto Chart Selection • 30+ Interactive chart type • 50+ Customization Options • Data mining and Insights Discovery • Analysis Explanation • Custom Keywords • Automatic Data Indexing • Sharing and Collaboration • Formula-based Columns • Datasets Joins • Administration Console • Scheduled Data Loads • Export to CSV, PNG or PDF • Column, Row and Dataset Permissions • Users Management • Interactive Dashboards

Average Rating: 3.8/5.0

Total Reviews: 2

Who Is the Company Behind AnswerDock?

  • Seller: AnswerDock
  • HQ Location: United Arab Emirates
  • Twitter: @AnswerDock
    19 Twitter followers
  • LinkedIn® Page: www.linkedin.com
    2 employees on LinkedIn®

Who Uses This Product?

  • Company Size: 100% Small

What Are Recent G2 Reviews of AnswerDock?

Artifactive

Artifactive hosts static HTML dashboards behind your company's existing login. Publishers upload files through a drag-and-drop web interface or directly from Claude Desktop using the Artifactive MCP extension. Each upload produces a gated link. When someone clicks the link, they sign in with their company email through Google Workspace, Okta, Entra, or any other identity provider and the dashboard loads. Pricing is based on publisher seats, not viewers. With two plans: 5 publishers or 15 publishers, both cover unlimited viewers. See pricing at artifactive.com/pricing. Custom domains are supported, so dashboards live at your company's URL. Built-in analytics show who viewed each dashboard and when. Artifactive is built for the people who create internal reports and dashboards, Analytics, RevOps, Strategy, Finance and need to share them with the rest of the company without configuring infrastructure or setting up hosting and access control.

Who Is the Company Behind Artifactive?

BI4SaaS

Who Is the Company Behind BI4SaaS?

  • Seller: BI4SaaS
  • Year Founded: 2023
  • HQ Location: Helsinki, FI
  • LinkedIn® Page: www.linkedin.com
    1 employees on LinkedIn®

BI4Web

BI4Web is a business intelligence tool that enables companies to make data-driven decisions. Its main features include the analysis of hierarchical structures, multidimensional analysis, reporting, and the most extensive catalog of native representations. Additionally, BI4Web offers a seamless experience across desktops, mobile devices, and tablets. BI4Web is aimed at companies seeking to extract value from their data. It is the perfect tool to drive digital transformation due to its simple configuration yet powerful results.

Who Is the Company Behind BI4Web?

bipp Analytics

bipp is a modern, cloud business intelligence platform that lets you explore billions of records in real-time. Simply connect your datasource, and build reusable data models with our Data Modeling Layer. Or explore your data with Visual SQL Data Explorer and create charts and dashboards in minutes. Ad-hoc or self-service reporting lets users slice and dice data to source trusted insights that drive business decisions. Insights can easily be shared through scheduled reports, data-based alerts, or embedded in applications.

Average Rating: 5.0/5.0

Total Reviews: 3

How Do G2 Users Rate bipp Analytics?

  • Has the product been a good partner in doing business?: 9.2/10 (Category avg: 8.9/10)
  • Steps to Answer: 8.3/10 (Category avg: 8.3/10)
  • Reports Interface: 10.0/10 (Category avg: 8.8/10)
  • Calculated Fields: 10.0/10 (Category avg: 8.5/10)

Who Is the Company Behind bipp Analytics?

  • Seller: BIPP
  • Year Founded: 2017
  • HQ Location: Wilmington, US
  • Twitter: @bippanalytics
    99 Twitter followers
  • LinkedIn® Page: www.linkedin.com
    9 employees on LinkedIn®

Who Uses This Product?

  • Company Size: 67% Small, 33% Medium

What Are Recent G2 Reviews of bipp Analytics?

What Are G2 Users Discussing About bipp Analytics?

Bijou Barry
BB
Researched and written by Bijou Barry
Updated October 3, 2024