Best Data Visualization Tools for Small Business - Page 6

How Many Data Visualization Tools Products Does G2 Track?

Total Products under this Category: 697

Category Stats (Nov 2026)

  • Average Rating: 4.44/5 The average rating of products in this category, based on all submitted ratings
  • Top Trending Product: Upsolve AI (+1.75%) - Among all products in this category, Upsolve AI recorded the largest rating increase compared to last month

Last updated: November 01, 2026

How Does G2 Rank Data Visualization Tools Products?

Why You Can Trust G2's Software Rankings:

  • 30 Analysts and Data Experts
  • 20,400+ Authentic Reviews
  • 697+ Products
  • Unbiased Rankings

G2's software rankings are built on verified user reviews, rigorous moderation, and a consistent research methodology maintained by a team of analysts and data experts. Each product is measured using the same transparent criteria, with no paid placement or vendor influence. While reviews reflect real user experiences, which can be subjective, they offer valuable insight into how software performs in the hands of professionals. Together, these inputs power the G2 Score, a standardized way to compare tools within every category.

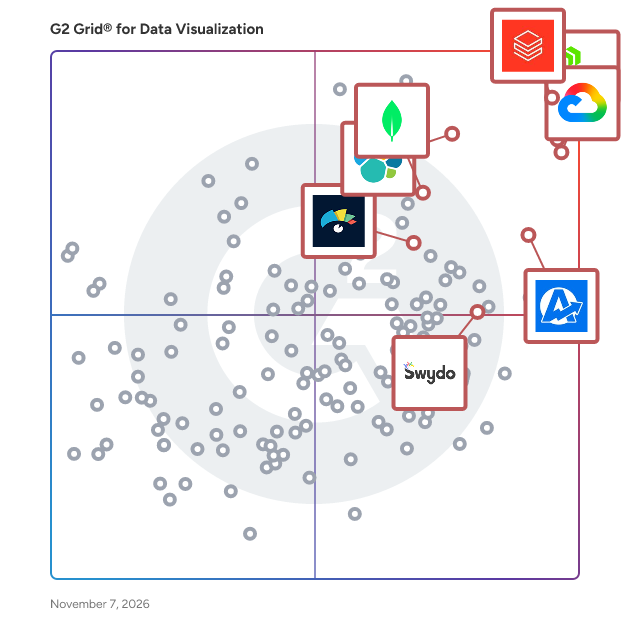
G2 Grid® for Data Visualization Tools

G2 Grid® for Data Visualization Tools plotting products by satisfaction and market presence

Highlighted products: Looker, AgencyAnalytics, Databricks, MongoDB Atlas, Visme, Domo, Elastic Stack, and Swydo.

Underlying data: [Grid® JSON](https://www.g2.com/categories/data-visualization-tools/grids.json?focus%5B%5D=looker&focus%5B%5D=agencyanalytics&focus%5B%5D=databricks&focus%5B%5D=mongodb-atlas&focus%5B%5D=visme&focus%5B%5D=domo&focus%5B%5D=elastic-stack&focus%5B%5D=swydo&segment=small-business)

Node

Discover our innovative approach to the cloud, designed to deliver an optimal online business management experience. Our secure, scalable, and powerful platform gives you real-time access to your data and management tools, wherever you are and on all your devices. Redefine the limits of collaborative work.

Average Rating: 4.2/5.0

Total Reviews: 27

How Do G2 Users Rate Node?

  • Has the product been a good partner in doing business?: 8.0/10 (Category avg: 9.0/10)
  • Dashboards: 8.8/10 (Category avg: 9.0/10)
  • Steps to Answer: 8.1/10 (Category avg: 8.6/10)
  • Formats: 8.4/10 (Category avg: 8.6/10)

Who Is the Company Behind Node?

Who Uses This Product?

  • Top Industries: Computer Software
  • Company Size: 41% Small, 30% Large

What Are Recent G2 Reviews of Node?

Orcablue

Orcablue is a fast and intuitive data visualization tool designed to seamlessly embed analytics into platforms. With Orcablue, companies can provide their customers with rich, customizable analytics experiences—ranging from standard reports to fully dedicated analytics portals without waiting. Whether it’s embedding interactive dashboards or delivering detailed insights, Orcablue empowers businesses to offer impactful, real-time analytics directly within their platform with minimal effort and easy customization.

Average Rating: 4.3/5.0

Total Reviews: 24

How Do G2 Users Rate Orcablue?

  • Has the product been a good partner in doing business?: 8.3/10 (Category avg: 9.0/10)

Who Is the Company Behind Orcablue?

Who Uses This Product?

  • Company Size: 92% Small, 8% Medium

What Do G2 Reviewers Say About Orcablue?

AI-generated summary from verified user reviews

Pros
  • Users value the ease of use of Orcablue, benefiting from its simplicity and efficiency across various industries.
  • Users praise the excellent customer support of Orcablue, providing quick and efficient solutions for their needs.
  • Users value the automation capabilities of Orcablue, significantly reducing manual effort and streamlining data processes.
  • Users appreciate the easy data visualization features of Orcablue, making analysis simple and effective with interactive graphics.
  • Users highly value the powerful business intelligence capabilities of Orcablue, enabling fast report generation and insightful automation.
Cons
  • Users note a steep learning curve with Orcablue, requiring time and resources for effective utilization of its tools.
  • Users find the missing real-time data analytics feature limits Orcablue's effectiveness for data analysis tasks.
  • Users face integration issues with Orcablue, hindering its full potential and complicating seamless system compatibility.
  • Users face technical issues like bright colors, stuck videos, and limited support that hinder their Orcablue experience.
  • Users find coding difficulties arise from inconsistent data formats, complicating data preparation for analysis.

What Are Recent G2 Reviews of Orcablue?

Easyflow.io

You have data - probably lots of it. That's not the problem. The real problem data is basically worthless unless you turn that data into insights - and that insights into action, without pain! Easyflow will help you succeed with this journey by allowing you to automate everything and visualise anything! It’s a drag-and-drop solution, no development skills required. With Easyflow you can connect apps, analyse data, and create automations and memorable KPI dashboard that work exactly how you want.

Average Rating: 4.5/5.0

Total Reviews: 47

How Do G2 Users Rate Easyflow.io?

  • Has the product been a good partner in doing business?: 9.0/10 (Category avg: 9.0/10)
  • Dashboards: 9.2/10 (Category avg: 9.0/10)
  • Steps to Answer: 9.2/10 (Category avg: 8.6/10)
  • Formats: 8.1/10 (Category avg: 8.6/10)

Who Is the Company Behind Easyflow.io?

  • Seller: Easyflow.io
  • Year Founded: 2019
  • HQ Location: Sydney, New South Wales
  • LinkedIn® Page: www.linkedin.com
    4 employees on LinkedIn®

Who Uses This Product?

  • Top Industries: Marketing and Advertising
  • Company Size: 77% Small, 13% Medium

What Are Recent G2 Reviews of Easyflow.io?

AI can help you find the answers. G2 helps you trust them.

Connect G2 to Claude or ChatGPT for answers grounded in G2's trusted reviews, comparisons, and pricing from real user insights.

How it works

Powerslide

Simplify the analysis and communication of your data, with a simple, interactive and efficient platform. Both intuitive and design, thanks to Powerslide, you can create your KPIs and data visualization in just a few clicks to stage them through a report, a dashboard, or an infographic to make them easier to understand. Powerslide is a: - An intuitive interface designed for business - A wide choice of data visualisations - A collaborative mode - Automated updates - Several connectors: CSV, Excel, Denodo, Snowflake, Google Sheets, API Rest, Zapier, Oracle, SQL Server, PostgreSQL, MySQL, Clickhouse…

Average Rating: 4.6/5.0

Total Reviews: 26

How Do G2 Users Rate Powerslide?

  • Has the product been a good partner in doing business?: 8.6/10 (Category avg: 9.0/10)
  • Dashboards: 8.7/10 (Category avg: 9.0/10)
  • Steps to Answer: 8.8/10 (Category avg: 8.6/10)
  • Formats: 8.3/10 (Category avg: 8.6/10)

Who Is the Company Behind Powerslide?

  • Seller: Datarocks
  • Year Founded: 2014
  • HQ Location: Saint-Denis, RE
  • LinkedIn® Page: www.linkedin.com
    1 employees on LinkedIn®

Who Uses This Product?

  • Top Industries: Marketing and Advertising
  • Company Size: 44% Medium, 37% Small

What Are Recent G2 Reviews of Powerslide?

What Are G2 Users Discussing About Powerslide?

Bijou Barry
BB
Researched and written by Bijou Barry
Updated