Best Embedded Business Intelligence Software - Page 11

How Many Embedded Business Intelligence Software Products Does G2 Track?

Total Products under this Category: 175

Category Stats (Sep 2026)

  • Average Rating: 4.44/5 (↑0.01 vs Aug 2026) The average rating of products in this category, based on all submitted ratings
  • Top Trending Product: ClicData (+1.36%) - Among all products in this category, ClicData recorded the largest rating increase compared to last month

Last updated: September 01, 2026

How Does G2 Rank Embedded Business Intelligence Software Products?

Why You Can Trust G2's Software Rankings:

  • 30 Analysts and Data Experts
  • 18,200+ Authentic Reviews
  • 175+ Products
  • Unbiased Rankings

G2's software rankings are built on verified user reviews, rigorous moderation, and a consistent research methodology maintained by a team of analysts and data experts. Each product is measured using the same transparent criteria, with no paid placement or vendor influence. While reviews reflect real user experiences, which can be subjective, they offer valuable insight into how software performs in the hands of professionals. Together, these inputs power the G2 Score, a standardized way to compare tools within every category.

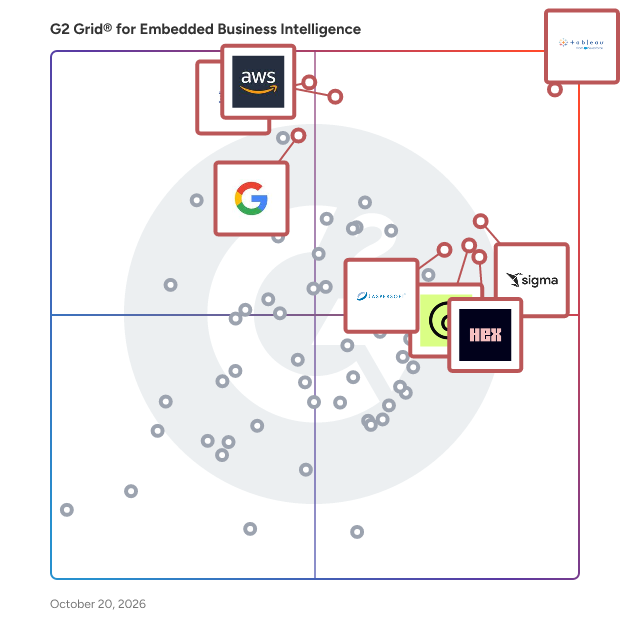
G2 Grid® for Embedded Business Intelligence Software

G2 Grid® for Embedded Business Intelligence Software plotting products by satisfaction and market presence

Highlighted products: Tableau, Amazon Quick, GoodData.AI, IBM Cognos Analytics, Hex, Sigma, Jaspersoft, and Domo.

Underlying data: [Grid® JSON](https://www.g2.com/categories/embedded-business-intelligence/grids.json?focus%5B%5D=tableau&focus%5B%5D=amazon-quick&focus%5B%5D=gooddata-ai&focus%5B%5D=ibm-cognos-analytics&focus%5B%5D=hex-tech-hex&focus%5B%5D=sigma-computing-sigma&focus%5B%5D=jaspersoft&focus%5B%5D=domo)

Personalisation

Finshape Personalisation & AI Financial Intelligence is a banking personalisation platform that enables financial institutions to transform transaction data into personalised customer insights, AI-driven interactions, and contextual financial experiences. The solution is designed to help banks deliver relevant customer engagement through digital banking channels by combining transaction enrichment, behavioural analytics, and artificial intelligence. The platform builds a personalisation layer on top of Finshape's Digital Bank Operating System (DBOS), using customer transaction data to generate financial insights, event-triggered notifications, personalised widgets, and conversational AI experiences. It supports real-time transaction enrichment, customer profiling, and AI-powered financial assistance, allowing customers to explore their finances through natural language conversations and contextual recommendations. Key capabilities include: - Real-time transaction enrichment and customer profiling - Personalised financial insights and behavioural analytics - AI Financial Assistant with conversational interactions - Event-triggered notifications and personalised widgets - Next-best-offer and next-best-action decisioning - ESG and carbon footprint insights - API-based integration with digital banking platforms and banking data infrastructure - Multi-language user interface with localization support Finshape Personalisation & AI Financial Intelligence is part of the Finshape digital banking portfolio and is intended for financial institutions that want to deliver data-driven customer experiences within their digital banking applications. The solution integrates with existing banking environments while enabling banks to provide personalised financial guidance and AI-powered customer interactions.

Who Is the Company Behind Personalisation?

  • Seller: Finshape
  • Year Founded: 2021
  • HQ Location: Prague, Prague, Czechia
  • LinkedIn® Page: www.linkedin.com
    371 employees on LinkedIn®

Plottable.js

Plottable.js provides flexible, interactive charts for the web.

Average Rating: 4.0/5.0

Total Reviews: 4

How Do G2 Users Rate Plottable.js?

  • Has the product been a good partner in doing business?: 8.3/10 (Category avg: 8.9/10)

Who Is the Company Behind Plottable.js?

  • Seller: Aunetic
  • Year Founded: 1989
  • HQ Location: Stockholm, SE
  • LinkedIn® Page: www.linkedin.com
    33 employees on LinkedIn®

Who Uses This Product?

  • Company Size: 75% Small, 25% Medium

What Are Recent G2 Reviews of Plottable.js?

PowerBI Robots

PowerBI Robots is a report scheduling and delivery solution for Microsoft Power BI that helps organizations automate the distribution of dashboards, reports, and visuals. Instead of relying on manual exports and repetitive sending processes, users can schedule deliveries and ensure Power BI content reaches the right people, at the right time, in the format they need. Built for teams that need to streamline recurring reporting workflows, PowerBI Robots allows users to send Power BI content through channels such as email, SharePoint, file systems, and web pages/slideshows. It supports multiple output options, including images, PDF files, and Excel files, helping organizations adapt reporting delivery to different business and operational needs. PowerBI Robots also allows users to create automated playlists, define recurrence rules, and personalize deliveries so different recipients can receive different views of the same Power BI content. This makes it especially useful for companies that need scalable, repeatable, and more controlled report distribution across teams, customers, partners, or locations. By reducing manual work and making report delivery more consistent, PowerBI Robots helps organizations save time, improve efficiency, and operationalize Power BI insights more effectively.

Who Is the Company Behind PowerBI Robots?

QuarkCube.IO

BUILD AI & NLP BASED ANALYTIC APPLICATIONS USING QUARKCUBE ENGINE

Who Is the Company Behind QuarkCube.IO?

Querypanel

QueryPanel is an embedded analytics platform for SaaS products. It offers a native React dashboard workspace and a headless Node SDK, with natural-language querying, tenant-scoped authentication and customer-specific dashboard customization. Its headless architecture can execute SQL inside the customer’s environment rather than storing database credentials with the analytics provider.

Who Is the Company Behind Querypanel?

RAPIDSEA

RAPIDSEA is a Rapid Product Development Suite engineered to streamline the creation of embedded solutions across diverse domains including automotive systems, industrial automation, medical devices, IoT platforms, and consumer electronics. It integrates proven embedded firmware modules, a rich collection of automotive and industrial protocol stacks, and a powerful OS-agnostic architecture, enabling engineering teams to develop high-performance embedded products faster, smarter, and more reliably. RAPIDSEA includes a comprehensive suite of protocol stacks such as: UDS, DoCAN, DoIP, CAN-IVN, Connectivity stack, J1939, OBD-II, SOME/IP, XCP Modbus, BACnet, HTTP/2, ProfiNet, DeviceNet, Ethernet/IP, GRPC stack, and many others. These stacks enable seamless integration with modern electronic systems. Designed specifically for software-defined embedded systems, RAPIDSEA empowers organizations to build adaptable, scalable, & future-ready products that meet evolving industry demands.

Who Is the Company Behind RAPIDSEA?

  • Seller: RAPIDSEA
  • Year Founded: 2010
  • HQ Location: Bengaluru, IN
  • LinkedIn® Page: www.linkedin.com
    1 employees on LinkedIn®

RCOR Intelliger

RCOR Intelliger is a cloud-based BI and data analytics platform that transforms your data into actionable insights. RCOR Intelliger integrates with 500+ data sources, including CRMs, ERPs, social media platforms, and more. With its pre-built dashboards, it provides managers, C-level executives, and business owners with AI-driven insights, enabling real-time access to key business data for better decision-making.

Who Is the Company Behind RCOR Intelliger?

  • Seller: RCOR
  • Year Founded: 2020
  • HQ Location: Dubai, AE
  • LinkedIn® Page: www.linkedin.com
    27 employees on LinkedIn®

ReGraph graph visualization toolkit for React

ReGraph is a React SDK for building browser-based, interactive, custom and high-performance graph visualizations that reveal threats and hidden insight. For React developers, ReGraph offers a simple and clean coding experience. It has familiar logic, easy state handling and well-documented props. It fits with any browser, device, server or database and comes with clear tutorials, demos and API documentation. Combined with our developer support, you’ll be uncovering network insight in no time. https://cambridge-intelligence.com/regraph/

Who Is the Company Behind ReGraph graph visualization toolkit for React?

Semaphor

Semaphor is a one-governed analytics platform that unifies traditional BI, embedded analytics, agentic analytics, and data apps on a single, semantically grounded foundation.

Who Is the Company Behind Semaphor?

Bijou Barry
BB
Researched and written by Bijou Barry
Updated October 3, 2024