AI-Generated Results
Finding matches…
Not seeing what you're looking for?
Dive deeper into "Statista" on G2 AI


Dash Lab is a Cassi.ai product that builds made-to-measure research dashboards, with matrices, segmentation, driver analysis, significance testing and tracking, and the base next to every number. Cassi.ai is a software engineering company for market research, innovation and insights.

Celeus is an AI statistics assistant for researchers in any field. Upload a dataset and Celeus suggests a suitable statistical test, runs it deterministically in R, and explains the result. The statistics are computed in R; an AI model writes the plain-language interpretation, drafts and edits text, answers questions in chat and, on request, suggests a test. Every analysis is seeded and ships as a reproducible package. No data rows ever reach the AI: it sees a de-identified profile of the dataset, aggregate results and the text you write.
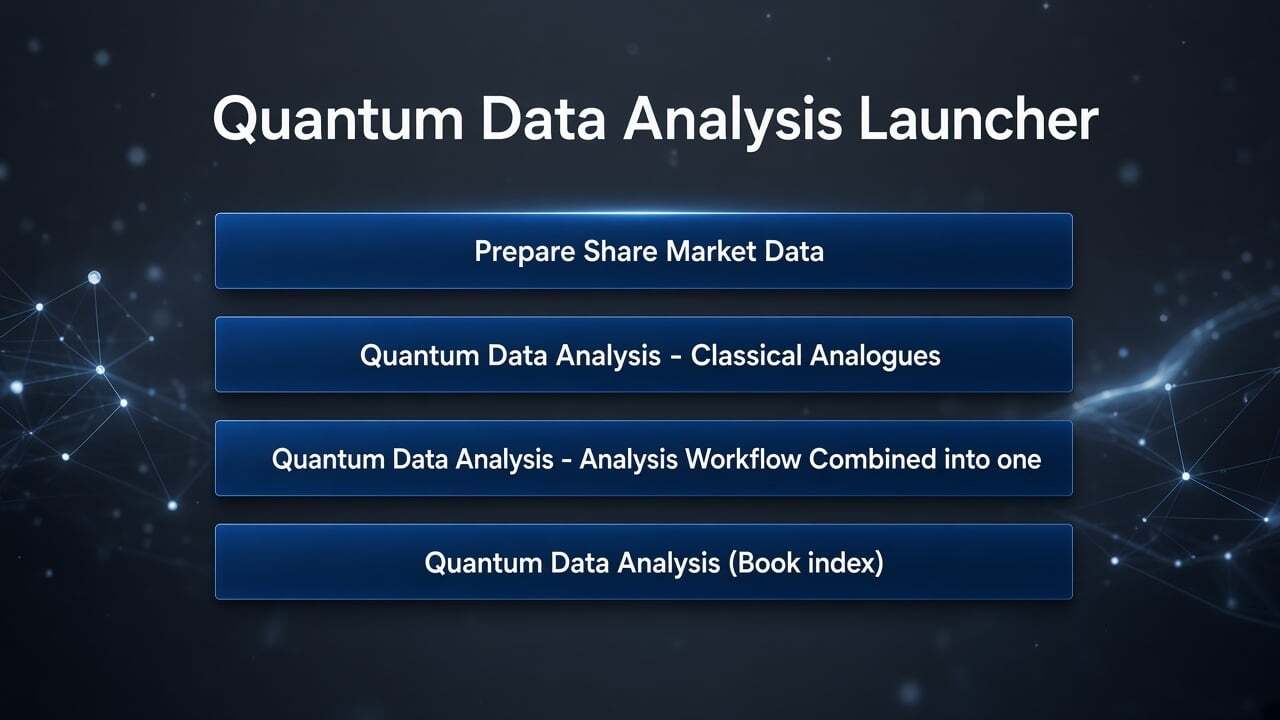
Excited to share my tool: Share Market Analysis Using Quantum Technology
I’ve developed a Quantum Data Analysis Toolkit that brings classical and quantum-inspired algorithms together for practical share market analysis.
Key capabilities:
→ Classical & Quantum Perceptron methods
→ Spectral norm and condition-number estimation
→ SVD representation extraction
→ Singular-value estimation
→ Monte Carlo techniques with quantum approaches
→ Built-in Market Data Downloader
Very Cheap Paid Download available here:
https://gnanasundaram-dhandapani.itch.io/share-market-analysis-using-quantum-technology
This project is aimed at traders, quantitative finance students, and researchers exploring quantum computing in finance.
Would appreciate any feedback or thoughts from the community.
#QuantumComputing #QuantitativeFinance #StockMarket #AlgoTrading #FinTech
Gnanasundaram Dhandapani
@dgsappsto2024

STAVEX is a very user-friendly software for effortless Design of Experiments (DoE) in the INTRAnet. The software follows the logical workflow of experimentation, from problem definition to detailed result analysis and visualization over the selection of an appropriate design. The intuitive STAVEX interface guides the user through these steps, providing him with many recommendations to facilitate the use of Design of Experiments. Therefore, STAVEX can be used easily both by people with little statistical knowledge and by experts. Originally developed in the chemical-pharmaceutical industry, STAVEX allows for process factors (temperature, concentration, ...) as well as for mixture factors (mixture components for galenic or adhesive formulations, ...) which have to fulfil a summation condition typical for formulations. It also supports the calculation of the Design Space by considering several responses at once. Finally, STAVEX runs in any web browser, making DoE easily accessible and its use as easy as booking a hotel.

CiviQual Stats is a Windows and browser application for statistical process control and Lean Six Sigma analysis. It draws the control chart, checks every point against the chosen run rules, and states the result in plain language beneath the chart. Its 40 tools are organized by DMAIC phase, and 24 of them are free with no time limit and no registration. Pro adds Gage R&R, designed experiments, regression, capability for non-normal data, CUSUM and EWMA charts, and the hypothesis-test suite for $149, paid once. It runs offline with no telemetry, activates with a key file that works on machines that block outbound traffic, and installs per user without administrator rights. Each release ships with a public validation report against NIST reference values and an independent implementation in R.

SPC ANALYZER is a desktop quality control application for one workstation, on Windows and macOS. The quality engineer brings in the measurements for a characteristic, and the application draws X-mR charts for individual values or X-bar R charts for subgroups, judges whether the process is stable and calculates Cpk and Ppk. It takes numerical and categorical data, and it flags outliers and missing values before they distort the limits. A finished analysis exports to Excel or PNG, batch summary reports cover several characteristics at once, and a report can be shared with a password and an expiration date. The application is sold by the month, by the year or as a lifetime license, and the monthly and yearly plans start with a 14-day free trial.

Survey analysis software for research agencies: crosstabs, weighting and editable client reports, in a browser.
Velocity (by Research Velocity) is survey analysis software for market research agencies. Open an SPSS, CSV or Excel survey file and it tabulates every question, with weights, subgroups, NETs and significance tests. Every figure can be inspected for who it counts, its base and the test behind it.
A report starts from the analyses as slides with headlines, charts and the base, weight and test beneath each one, and exports as editable PowerPoint. On the Professional plan an exported deck can be updated when the data changes, and reports can go to Google Slides.
Velocity (by Research Velocity) also opens a Q project: a QPack, or a .Q file with its data. It reads the definitions, weight and tables, counts each table again and compares its figures with the PowerPoint exported from Q. Q's R and JavaScript rules are kept and not run.
The Advanced plan adds key drivers, TURF, price testing, correspondence analysis, factor analysis and segments. Velocity (by Research Velocity) does not have MaxDiff, conjoint or latent class.
Analysis runs in the browser on your computer. Projects are saved to your account in the European Union. Subscriptions are for UK work use; the 14-day trial needs no card.
An alternative to Q Research Software, Displayr and SPSS.

xellstorm runs Monte Carlo simulation on the Excel models you already have. Open an .xlsx, .xlsm or .xls workbook in your browser, mark the assumptions that are uncertain and the results you care about, and run. You get the chance of hitting your budget, date or target, what drives it, and which decision works best.
There is nothing to install and Excel is not needed: it runs in the browser on Windows, macOS and Linux. Your workbook is calculated inside your browser tab and the file is never uploaded. It stays a plain Excel file, with no add-in functions written into it.
Models written with @RISK, ModelRisk or Analytic Solver functions open as they are: xellstorm reads the add-in's functions, sets up the simulation from them, and lists what it converted and what it left.
Export a results workbook, a single-file HTML report or PowerPoint slides with editable charts. Readers need no license.
An AI assistant such as Claude can set up and run the simulation through the MCP connector, once you allow it in the app.
Free for learning, teaching, academic research and non-profits. For work: $588 per user per year, or $59 month to month, with a 30-day free trial and no card needed.

Upload a spreadsheet and say what you want to find out. StatEVN picks the right statistical model, checks it and explains the answer in plain words.

Adviota is an AI survey analysis tool for research teams and market research agencies. Upload an SPSS, Excel, CSV or PDF file, ask questions in plain language and get answers calculated from your data, with the table, base, weighting and significance shown every time. Data is processed and stored in the EU.

Jenner is a SAS-compatible analytics platform: it runs your existing SAS programs without a SAS license. DATA steps, PROC SQL, the macro facility and a large procedure library all accept standard SAS syntax, so the programs you already have generally run as-is rather than being rewritten first.
Built in Rust, Jenner runs natively on macOS (including Apple silicon), Windows and Linux, and in a collaborative browser-based workspace. It reads and writes SAS7BDAT and XPT datasets directly, and adds modern I/O that SAS does not have: CSV and Parquet, direct database connectors, and a native Jupyter kernel.
Statistical and time-series procedures accept standard SAS syntax while using Python (statsmodels) or R (survival, forecast) as their computational backend.
Teams use Jenner to keep an existing SAS codebase running while removing per-seat SAS licensing; to give analysts a native option on macOS, where SAS ships no Mac build; and to expose SAS-compatible execution to AI agents and coding assistants through an open Run API.


Anthrena Desk is an AI-native desktop analytics workspace designed for analysts, business teams, researchers, and decision-makers who want to explore, analyze, visualize, and understand data without relying on complex BI infrastructure.
It combines the familiarity of spreadsheets with powerful analytics, interactive dashboards, statistical analysis, data preparation, forecasting, and AI-assisted workflows in a single desktop application.
Anthrena Desk is built around a local-first architecture, allowing users to work directly with their data on their own machine instead of requiring every dataset to be uploaded to a cloud platform. Users can connect to files and databases, clean and transform data, perform exploratory and statistical analysis, build charts and dashboards, and create reusable analytical workflows.
Key capabilities include:
* Spreadsheet-style data exploration and analysis
* Interactive charts, dashboards, and data storytelling
* Data cleaning, transformation, and feature engineering
* Statistical analysis and hypothesis testing
* Forecasting and predictive analytics
* Pivot-style multidimensional analysis
* Multi-dataset and multi-sheet analysis
* AI-assisted analytical workflows
* Extensible plug-in architecture for specialized analytics
* Local-first processing for greater data control
* Desktop support for Windows, macOS, and Linux
Anthrena Desk is designed to reduce the gap between spreadsheets, statistical tools, BI platforms, and AI-powered analytics. Instead of moving between multiple applications for data preparation, analysis, visualization, and decision support, users can perform the complete analytical workflow from one workspace.
The goal of Anthrena Desk is simple: make advanced analytics accessible while giving experienced analysts the flexibility and depth they need.

DynamiScan allows you to easily scan offers being redeemed from your plastic postcard mailers at the point of sale and identify statistically which demographics are responding to your advertising, which offers perform best, and which demographic/offer combo drives the highest average ticket. Additionally DynamiScan also collects the names and addresses of each respondent.

Stanford Phrasal is a statistical phrase-based machine translation system, written in Java that provides much the same functionality as the core of Moses it include: providing an easy to use API for implementing new decoding model features, the ability to translating using phrases that include gaps (Galley et al. 2010), and conditional extraction of phrase-tables and lexical reordering models.

We are Instill, an AI-Driven Culture Operating System that allows you to turn your culture into your competitive advantage.
Designed by leading psychologists, Instill uses culture codification tools paired with machine learning, natural language processing, and statistical correlation to quantify key elements of your culture and suggest interventions to design, evolve, measure, and scale a high-performing team.

GeoTwinX performs a range of tasks, including data collection from diverse sources, data management for organization and retrieval, and data analysis to uncover patterns and relationships. They enable the integration and manipulation of geospatial data, such as maps, and demographic information, allowing for spatial analysis and modeling. GeoTwinX supports decision-making processes by providing insights through spatial querying, overlay operations, and statistical analysis.

SDV lets developers easily build, deploy and manage sophisticated generative AI models when real data is limited or unavailable. These models create synthetic data that is statistically similar to original data. SDV is currently commercialized by DataCebo, which offers an Enterprise SDK ("SDV Enterprise") so that developers can easily build, deploy and manage sophisticated generative AI models for enterprise-grade applications.